Coating uniformity is a critical parameter in coating processes in novel pharmaceutical formulations. Speaking about pellet technology, coating and layering are the main methods for implementing drug functionalities, such as modified release of the active, taste-masking properties and further more. Coating uniformity guaranties not only upholding functionalities of the formulation, but also prevent risks such as dose dumping.
This application note is based on a publication of Wörthmann et al. [1] and focuses on selected aspects which are related to starter cores.
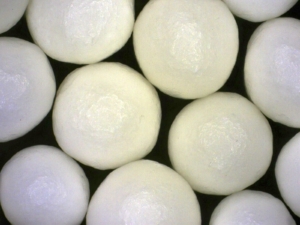
Figure 1: Microscopic image of Cellets® 1000, magnification 100x.
Coating was applied on highly spherical starter cores Cellets® 1000 (Figure 1). The pellets have a relatively narrow size distribution with a mean particle size of d50 = 1197 μm, a standard deviation of σ = 113 μm, and particle density of 1.4 g/cm3. For analyzing the coating uniformity, stearin (54 % stearic acid and palmitic acid) and hydrogenated palm oil were used. For the hot-melt coating experiments a lab-scale Wurster fluidized bed was used. The overspray rate was estimated to 8 % (w/w). Processed particles were analyzed by image analysis (Figure 2) and micro-computed-tomography (μCT) (Figure 3). 2D and 3D software analysis were further conducted for the evaluation of the sphere dimension, layer thickness and coating uniformity.
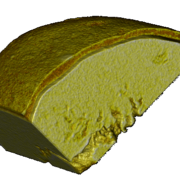
Figure 2 shows a wax-coated particle, where the coating thickness varies and delamination is clearly visible (Figure 3). Small pores and fractions of the coating layer area are obvious.
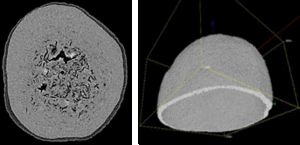
Figure 2: Images of coated pellets are used for a stepwise evaluation of the particle shell thickness. A: original image; B: segmented coating layer. Further software calculation steps are not shown here.
These undesired artefacts result from imperfect parameters, such as spreading mechanism, temperature fluctuations, viscosity, or drop size.
The coating layer thickness is analyzed for three particles of the same batch (Figure 4) using 5 % (w/w) stearin at a spraying rate of 1 g/min. The layer thickness varies between approximately 2 µm to 30 µm. A mean coating thickness is found between 12 µm and 16 µm.
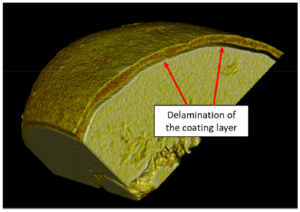
Figure 3: Portion of a micro-computed-tomography image of a wax-coated particle showing.
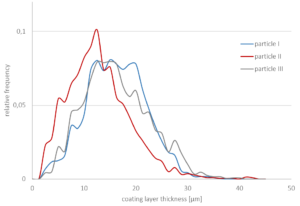
Figure 4: Relative frequency of the coating layer-thickness of three particle shells from the same batch using 5 % (w/w) stearin at a spraying rate of 1 g/min. Mean thicknesses: particle I (blue): 15.5 μm, particle II (red): 12.4 μm, and particle III (grey): 15.6 μm.
In terms of customer safety and of compliance aspects, not only statistical information about the layer thickness are of interest. In case of inhomogeneous layers, taste-masking functionalities or even uncontrolled dose dumping might occur. In this context, a single-particle analysis is mandatory. 3D µCT is a powerful tool, which is complementary to existing methods, such as laser imaging methods, 2D analysis or thickness estimations. The analyzed mean thickness deviates by approximately 13 % among these methods (Figure 5).
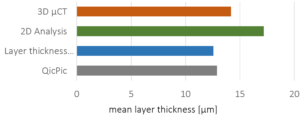
Figure 5: Mean layer-thicknesses measured using different methods. Relative standard deviation: 13 %.
Microcrystalline cellulose pellets (Cellets®) are used to study coating uniformity. 3D μCT can be a powerful tool to assess the quality of the final product coating and facilitates the selection of an appropriate combination of core particles and coating material. 3D visualization methods allow a critical single-particle analysis with a resolution of up to 2 µm. Furthermore, the determination of the particle’s uncoated surface area can be specified.
Prof. Heiko Briesen, Mario Wörthmann (Technical University Munich) and team are gratefully acknowledged for serving content for this note.
Research was financially supported by the Ministry of Economics and Energy (BMWi) and FEI (Germany) via project AiF 19970 N. Equipment funded by Deutsche Forschungsgemeinschaft (DFG, Germany) 198187031.
[1] B.M. Woerthmann, J.A. Lindner, T. Kovacevic, P. Pergam, F. Schmid, H. Briesen, Powder Technology 378 (2021) 51–59
Amorphous solid dispersions layered pellets solve a problem of poorly water soluble drugs. Speaking about oral drug formulations, drug carrier solutions based on starter cores are suitable for several drug classes and open new opportunities for modified drug release profiles. Layering and coating techniques, such as Wurster fluid bed process at different batch sizes, are well established.
However, an increasing number of poorly water soluble drugs challenges modern formulations. A novel approach improving the solubility of those drugs is to formulate them as amorphous solid dispersions (ASD) with a suitable polymer candidate [1]. In this study, Nifedipine was used as a model drug. Nifedipine manages angina, high blood pressure, Raynaud’s phenomenon, and premature labor [2].
ASD formulations can be performed by hot-melt extrusion or spray drying technique. Both techniques have disadvantages such that hot-melt extrusion cannot be employed for temperature-sensitive drugs [3], and spray drying needs a further compaction step not to result in fine powder with poor flowability, broad particle size distribution and high sensitivity to electrostatic charge. Therefore, a further compaction step is required to obtain a freely flowable product [4].
In this context, two techniques for the preparation of ASDs are compared: A 6”-Wurster fluid bed with Type-C bottom plate (Glatt, Germany) and spouted bed (ProCell5™ with Zig-Zag-sifter, Glatt, Germany) are used.
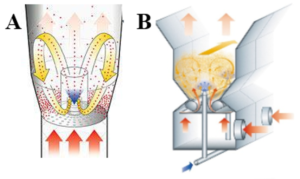
Fig. 1: A: 6”-Wurster fluid bed; B: ProCell5™ spouted bed.
The formulation contains the drug and a stabilizing co-polymer (Kollidon®, KVA64, BASF, Germany). Nifedipine and Kollidon are mixed resulting in a drug load of 40 % (w/w) and dissolved in Acetone (30 % w/w solid content).
| Parameter | FB | SB |
| Spray rate [g/min] | 20 | 20-35 |
| Product temp. [°C] | 50-60 | 50-60 |
| Process gas temp. [°C] | 65 | 80 |
| Process air flow [m³/h] | 180-200 | 65-120 |
| Spraying nozzle diameter [mm] | 1.2 | 1.2 |
| Spraying pressure [bar] | 2.0 | 0.5 |
Table 1: Manufacturing parameters for fluid bed (FB) and spouted bed (SB).
In the fluid bed process, microcrystalline pellets (Cellets® 500, IPC Dresden, Germany) were layered with the spraying solution such that a drug load of 21.8 % (w/w) is reached. In the spouted bed process, fine powder is generated by spray drying, further agglomeration and layering. An overview on the process parameters is given in Table 1.
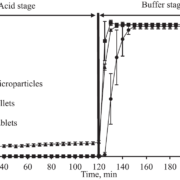
Dissolution tests were conducted in a PBS buffer at pH 6.8 and 37 °C (± 0.5 °C). A physical mixture of Nifedipine and KVA64 (40 % w/w drug load) is used as reference.
In the following, results from both experiments, which are amorphous solid dispersions layered pellets (fluid bed) and ASD pellets from direct pelletization (spouted bed) are compared.
ASD layered pellets show a better sphericity, higher level of monodispersity and better flowability properties than the ASD pellets from direct pelletization (Figure 2). Nonetheless, it has to be pointed out that both techniques result in a high particle quality for capsule filling. Analysis data is shown in Table 2.
| Parameter | FB | SB |
| D10 [µm] | 824 ± 23 | 559 ± 28 |
| D50 [µm] | 943 ± 13 | 732 ± 50 |
| D90 [µm] | 1091 ± 11 | 1374 ± 410 |
| Bulk density [g/L] | 427 | 280 |
| Flowability [s/100g] | 12.1 | 16.2 |
Table 2: Analysis of ASD layered pellets (FB) and ASD pellets from direct compaction (SB).
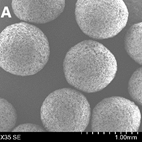
Fig. 2a: SEM images of processed pellets. A: ASD layered pellets based on Cellets® (FB)
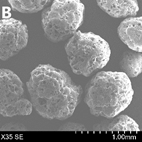
Fig. 2b: SEM images of processed pellets. B: ASD pellets from direct pelletization (SB)
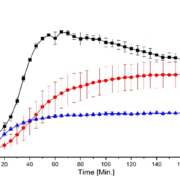
Independent from the processing technique, pellets achieved an approximately factor 2 higher end concentration than the physical mixture. Pellets obtained from the fluid bed process showed a clear supersaturation phase after 1 hour and a generally higher dissolution rate than pellets obtained from the spouted bed process. Contrarily, the dissolution rate of the latter pellets approaches the supersaturation phase more continuously after 3 hours.
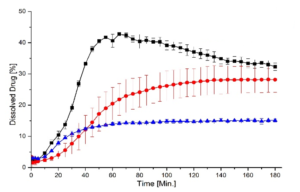
Fig. 3: Dissolution as a function of time. Black: ASD layered pellets (FB). Red: ASD pellets from direct pelletization (SB). Blue: physical mixture.
Summary
Both techniques, fluid bed and spouted bed as well, can be employed for manufacturing amorphous solid dispersions with good flow properties and dissolution profiles. Both techniques can be scaled up to pilot and production scale for batch or continuous manufacture of freely flowable ASDs. Cellets® serve stable and reliable cores for this venture.
We gratefully acknowledge Dr. Annette Grave and Dr. Norbert Pöllinger (Glatt Pharmaceutical Services, Germany), and Prof. Karl G. Wagner and Marius Neuwirth (University Bonn, Germany).
[1] T. Vasconcelos, B. Sarmento, and P. Costa, Drug Discovery Today, 12(23): 1068-1075 (2007)
[2] “Nifedipine”. The American Society of Health-System Pharmacists. Retrieved: Sept 17, 2019.
[3] J. Breitenbach, European Journal of Pharmaceutics and Biopharmaceutics, (54)2: 107-117 (2002)
[4] I. Weuts et al., Journal of Pharmaceutical Sciences, (100)1: 260-274 (2011)