
Research Advances in MCC Pellet Technology and Applications
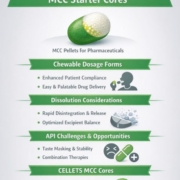
Scientific literature on MCC pellets highlights the growing importance of CELLETS® in pharmaceutical and scientific research. These microcrystalline cellulose spheres play a key role in developing reliable multiparticulate drug delivery systems. Researchers have investigated improved rivaroxaban dissolution, efficient film coating kinetics, and their use in orally disintegrating films. In addition, studies focus on colon-targeted vitamin B₂ release and fluidized-bed coating performance. Moreover, academic theses explore uniform hot-melt coating techniques and detailed modeling of tablet disintegration. As a result, MCC pellets continue to prove their versatility across many dosage forms. Consequently, this expanding body of literature reinforces the value of CELLETS® in advancing modern drug delivery technologies.
Selected Scientific literature on MCC pellets
Please, find scientific literature on MCC pellets (CELLETS®), MCC spheres. This list is constantly updated and does not claim to be complete. If you are author, scientist or R&D specialist, please submit your present publication to us for improving the visibility.
List – Publications with MCC spheres, 2026
Research article
High-Potency Pellet Microdosing Technology: A smart and easy way for production of low-dose active-ingredient capsules.
Tech4Pharma, 16(2), 2026, 58
A. Grave, E. Sternberger-Rützel
Research article
Formulation and Functional Characterization of a Novel Co-Processed Excipient for Direct Compression: Evaluation by the SeDeM Expert System
Preprint; doi: 10.20944/preprints202604.0109.v1
A. Ciurba, P. Antonoaea, E.-M. Rédai, A. Pintea, C. Pintea, A.-A. Cojocariu, M. Bîrsan, M.-F. Mihalcea, R.-A. Vlad
Research article
Challenges in the Oral Administration of Gastro-Resistant Formulations: The Role of Vehicles and Bottled Waters
Pharmaceutics 2026, 18(4), 453; doi: 10.3390/pharmaceutics18040453
A.K. Demeter, D. Farkas, M. Király, Á.T. Barna, K. Ludányi, I. Antal, N. Kállai-Szabó
Poster
Investigation of Pellet Agglomeration in Fluidised Bed Coating Processes: Influences of Size, Material, and Dispersion
Poster contribution, 2026
R. Jurek; M. Lachmann; E. Kempnich; K. Köhler
Research article
Pharmaceutical development of composition of effervescent tablets with acetylsalicylic acid, paracetamol, and ascorbic acid
Pharmaceutical Science Advances 4 (2026) 100123. doi: 10.1016/j.pscia.2026.100123
O. Panysheva
Research article
Enhancement of the Solubility and Dissolution Profile of Rivaroxaban by the Antisolvent Precipitation Technique: A Promising Approach
Polymers 2026, 18(9), 1134; doi: 10.3390/polym18091134
C. M. Benga, E. A. Ozon, A. M. Musuc, V. Anuța, I. Sârbu, V.-A. Surdu, F. Teodorescu, A. Rusu, L. Popa, M. V. Ghica, A. Chandak, C. E. D. Pîrvu
Research article
Modelling of Rheological Properties of Pharmaceutical Powder Mixtures for Direct Compression: A Statistical Approach
PharmSciTech 27, 121 (2026). doi: https://doi.org/10.1208/s12249-026-03359-w
P. Komínová, M. Gajdošová, D. Smrčka, P. Zámostný
Book
Pediatric Formulations – Micropellets: A Modern Multiparticulate Technology Platform for Pediatric Medicines | Springer Nature Link
Springer Cham (17 February 2026), ISBN 978-3-031-77239-9
H. Batchelor, K. Rose (Editors)
Book
GLATT-Wirbelschichttechnologie zum Coating von Pulvern, Pellets und Mikropellets
Springer-Verlag GmbH (02 January 2026), ISBN 978-3-662-71411-9 (print), 978-3-662-71412-6 (online); doi: 10.1007/978-3-662-71412-6_4
Annette Grave & Norbert Pöllinger
List – Publications with MCC spheres, 2025
Research article
Sustainable nanoarchitectonics of cellulose-derived spherical activated carbon for efficient uremic toxin removal in pharmaceutical applications
Materials & Design 259 (2025) 114892. doi: 10.1016/j.matdes.2025.114892
K. Shin, S.-B. Kim, Y.-H. Kim, D.-D. Kim, S.-Y. Lee, S.-J. Park
Research article
The Development and Characterization of Layered Pellets Containing a Combination of Amorphized Amlodipine Besylate and Hydrochlorothiazide Using a High-Shear Granulator
Pharmaceuticals 2025, 18(10), 1496. doi: 10.3390/ph18101496
A. A. K. Mahmoud, K. Ludasi, D. G. Dobó, D. Sebők, Á. Kukovecz, V. Hornok, K. Sajdik, T. Szabó, T. Sovány, G. Regdon, K. Kristó
Research article
Ultrasound Imaging of Artificial Tongues During Compression and Shearing of Food Gels on a Biomimetic Testing Bench
Journal of Texture Studies (2025) 56:e70030. doi: 10.1111/jtxs.70030
M. Glumac, J.-L. Gennisson, V. Mathieu
Research article
In vitro validation of colon delivery of vitamin B2 through a food grade multi-unit particle system
International Journal of Pharmaceutics (2025), 675, 125546. doi: 10.1016/j.ijpharm.2025.125546
M. Wolfgang, J. Poms, V. Herndler, I. Huegel, T. Kipping, M. Spoerk, J.G. Khinast
List – Publications with MCC spheres, 2024
Research article
In vitro validation of colon delivery of vitamin B2 through a food grade multi-unit particle system
Wageningen Academic (2024), eISSN: 1876-2891; doi:10.1163/18762891-bja00045
R.E. Steinert, W. Sybesma, R. Duss, A. Rehman, M. Watson, T.C. van den Ende, E. Funda
Research article
Homogeneity and mechanical properties of orodispersible films loaded with pellets
Eur. J. Pharm. Biopharm. 2024, 114537; doi:10.1016/j.ejpb.2024.114537
K. Centkowska, M. Szadkowska, M. Basztura, M. Sznitowska
Patent
Extended-release compositions comprising atomoxetine
A1
Patent
Extended release compositions comprising pyridostigmine
A1
Research article
Influence of Polymer Film Thickness on Drug Release from Fluidized Bed Coated Pellets and Intended Process and Product Control
Pharmaceutics 2024, 16(10), 1307; https://doi.org/10.3390/pharmaceutics16101307
M. Langner, F. Priese, and B. Wolf
Thesis
Characterization of dense granular flows using a continuous chute flow rheometer
Purdue University, School of Materials Engineering, West Lafayette, Indiana, posted on 2024-07-20, 03:12
Kayli Lynn Henry
Research article
The Increase in the Plasticity of Microcrystalline Cellulose Spheres’ When Loaded with a Plasticizer
Pharmaceutics (2024), 16(7), 945; doi: 10.3390/pharmaceutics16070945
A. Paulausks, T. Kolisnyk, V. Mohylyuk
Research article
The development of an innovative method to improve the dissolution performance of rivaroxaban
Heliyon 10(12), 2024, e33162; doi: 10.1016/j.heliyon.2024.e33162
E.A. Ozon, E. Mati, O. Karampelas, V. Anuta, I. Sarbu, A.M. Musuc, R.-A. Mitran, D.C. Culita, I. Atkinson, M. Anastasescu, D. Lupuliasa, M.A. Mitu
Thesis
Uniform and homogenous hot-melt coating in a Wurster fluidized bed
TUM School of Life Sciences der Technischen Universität München, 2024
B. M. Wörthmann
Thesis
Modelling the disintegration of pharmaceutical tablets: integrating a single particle swelling model with the discrete element method
University of Strathclyde, Strathclyde Institute of Pharmacy and Biomedical Sciences, CMAC National Facility, 2024, Thesis identifier T16863
M. Soundaranathan
List – Publications with MCC spheres, 2023
Research article
Paediatric solid oral dosage forms for combination products: Improving in vitro swallowability of minitablets using binary mixtures with pellets
European Journal of Pharmaceutical Sciences (2023), 187, 106471; doi:10.1016/j.ejps.2023.106471
A. Avila-Sierra, A. Lavoisier, C. Timpe, P. Kuehl, L. Wagner, C. Tournier, M. Ramaioli
Research article
Continuous Manufacturing of Cocrystals Using 3D-Printed Microfluidic Chips Coupled with Spray Coating
Pharmaceuticals (2023), 16(8), 1064; doi:10.3390/ph16081064
A. Kara, D. Kumar 2, A.M. Healy, A. Lalatsa, and D.R. Serrano
Research article
High-Speed Tableting of High Drug-Loaded Tablets Prepared from Fluid-Bed Granulated Isoniazid
Pharmaceuticals (2023), 15(4), 1236; doi:10.3390/pharmaceutics15041236
V. Mohylyuk, and D. Bandere
Research article
The Effect of Design and Size of the Fluid‑Bed Equipment on the Particle Size‑Dependent Trend of Particle Coating Thickness and Drug Prolonged‑Release Profile
AAPS PharmSciTech (2023) 24, 93. doi:10.1208/s12249-023-02540-9
T. Brezovar, G. Hudovornik, M. Perpar, M. Luštrik, R. Dreu
Research article
Amorphous Solid Dispersions Layered onto Pellets—An Alternative to Spray Drying?
Pharmaceutics (2023) 15(3), 764. doi:10.3390/pharmaceutics15030764
M. Neuwirth, S.K. Kappes, M.U. Hartig, K.G. Wagner
Research article
Optimization of Fluidized-Bed Process Parameters for Coating Uniformity and Nutrient-Release Characteristics of Controlled-Release Urea Produced by Modified Lignocellulosic Coating Material
Agronomy (2023) 13(3), 725. doi:10.3390/agronomy13030725
A.M. Ali, B. Azeem, A.M. Alghamdi, K. Shahzad, A. Ahmad Al-Zahrani, M. Imtiaz Rashid, A. Binti Mahpudz, A. Jamil
Research article
Hydrodynamic behaviour of CELLETS® (Ph.Eur./USP) in a spouted bed using image processing method
Particuology (2023), 76, 101-112, doi:10.1016/j.partic.2022.07.009
J. Vanamu, A. Sahoo
Thesis
Oral delivery of microbiome-modulating synbiotics derived from kefir via alginate encapsulation systems
School of Materials Science and Engineering (2023); doi: 10.32657/10356/164624
L.L. Tan
List – Publications with MCC spheres, 2022
Research article
Product-Property Guided Scale-Up of a Fluidized Bed Spray Granulation Process Using the CFD-DEM Method
Processes (2022) 10(7), 1291. doi:10.3390/pr10071291
P. Kieckhefen, S. Pietsch-Braune, S. Heinrich
Research article
Influence of In Situ Calcium Pectinate Coating on Metoprolol Tartrate Pellets for Controlled Release and Colon-Specific Drug Delivery
Pharmaceutics (2022) 14(5), 1061. doi: 10.3390/pharmaceutics14051061
P. Wanasawas, A. Mitrevej, N. Sinchaipanid
Research article
Delamination and wetting behavior of natural hot-melt coating materials
Powder Technology (2022) 404, 117443. doi: 10.1016/j.powtec.2022.117443
B.M. Woerthmann, L. Totzauer, H. Briesen
Research article
A systematic approach for assessing the suitability of enteral feeding tubes for the administration of controlled-release pellet formulations
International Journal of Pharmaceutics (2022) 612, 121286. doi: 10.1016/j.ijpharm.2021.121286
F. Karkossa, N. Lehmann, S. Klein
Research article
Spray-freeze-dried lyospheres: Solid content and the impact on flowability and mechanical stability
Powder Technology (2022) 411, 117905. doi:10.1016/j.powtec.2022.117905
A. Rautenberg, A. Lamprecht
Conference proceedings
Assessment of the effect of microcrystalline cellulose (MCC) spheres size on the flow via powder rheology
The FORGE, 2022 – pure.qub.ac.uk; doi: 10.13140/RG.2.2.14935.75688
V. Mohylyuk, R. Dattani
Research article
Solventless amorphization and pelletization using a high shear granulator. Part II; Preparation of co-amorphous mixture-layered pellets using indomethacin and arginine
European Journal of Pharmaceutics and Biopharmaceutics (2022) 181, 183-194. doi: 10.1016/j.ejpb.2022.11.011
K. Kondo, T. Rades
Research article
Solventless amorphization and pelletization using a high shear granulator. Part I; feasibility study using indomethacin
European Journal of Pharmaceutics and Biopharmaceutics (2022) 181, 147-158. doi: 10.1016/j.ejpb.2022.11.010
K. Kondo, T. Rades
Research article
Application of different models to evaluate the key factors of fluidized bed layering granulation and their influence on granule characteristics
Powder Technology (2022), 408:117737. doi: 10.1016/j.powtec.2022.117737
R. Maharjan, S. H. Jeong
Research article
Evaluation of gravitational consolidation of binary powder mixtures by modified Heckel equation
Powder Technology (2022), 408:117729. doi: 10.1016/j.powtec.2022.117729
P. Svačinová, O. Macho, Ž. Jarolímová, M. Kuentz, Ľ. Gabrišová and Z. Šklubalová
Research article
Integrated Purification and Formulation of an Active Pharmaceutical Ingredient via Agitated Bed Crystallization and Fluidized Bed Processing
Pharmaceutics (2022), 14(5)1058. doi: 10.3390/pharmaceutics14051058
M. W. Stocker, M. J. Harding, V. Todaro, A. M. Healy and S. Ferguson
List – Publications with MCC spheres, 2021
Research article
Correlating Granule Surface Structure Morphology and Process Conditions in Fluidized Bed Layering Spray Granulation
KONA Powder and Particle Journal (2021), DOI:10.14356/kona.2022016
M. Orth, P. Kieckhefen, S. Pietsch and S. Heinrich
Research article
Relative bioavailability enhancement of simvastatin via dry emulsion systems: comparison of spray drying and fluid bed layering technology
Eur J Pharm Biopharm (2021), S0939-6411(21)00353-2. doi: 10.1016/j.ejpb.2021.12.004
M. Pohlen, J. Aguiar Zdovc, J. Trontelj, J. Mravljak, M. G. Matjaž, I. Grabnar, T. Snoj and R. Dreu
Research article
A novel method for assessing the coating uniformity of hot-melt coated particles using micro-computed tomography
Powder Technology, Volume 378, Part A, 22 January 2021, Pages 51-59
B.M. Woerthmann, J.A. Lindner, T. Kovacevic, P. Pergam, F. Schmid, H. Briesen
List – Publications with MCC spheres, 2020
Research article
Fixed-bed-column studies for methylene blue removal by cellulose CELLETS
Environmental Engineering and Management Journal 19 (2020), 2, 269-279
Iulia Nica, Gabriela Biliuta, Carmen Zaharia, Lacramioara Rusu, Sergiu Coseri, Daniela Suteu
Research article
Material specific drying kinetics in fluidized bed drying under mechanical vibration using the reaction engineering approach
Advanced Powder Technology, Volume 31, Issue 12, December 2020, Pages 4699-4713
Soeren E. Lehmann, Tobias Oesau, Alfred Jongsma, Fredrik Innings, Stefan Heinrich
Research article
Simulation of pellet coating in Wurster coaters
International Journal of Pharmaceutics, Volume 590, 30 November 2020, 119931
Hamid Reza Norouzi
Research article
Quantification of swelling characteristics of pharmaceutical particles
International Journal of Pharmaceutics, Volume 590, 30 November 2020, 119903
Mithushan Soundaranathan, Pattavet Vivattanaseth, Erin Walsh, Kendal Pitt, Blair Johnston, Daniel Markl
Short communication
Introduction of the energy to break an avalanche as a promising parameter for powder flowability prediction
Powder Technology, Volume 375, 20 September 2020, Pages 33-41
Žofie Trpělková, Hana Hurychová, Martin Kuentz, Barbora Vraníková, Zdenka Šklubalová
Research article
Easy to Swallow “Instant” Jelly Formulations for Sustained Release Gliclazide Delivery
Journal of Pharmaceutical Sciences, Volume 109, Issue 8, August 2020, Pages 2474-2484
Simmi Patel, Nathan Scott, Kavil Patel, Valentyn Mohylyuk, William J. McAuley, Fang Liu
Research article
Regulating the pH of bicarbonate solutions without purging gases: Application to dissolution testing of enteric coated tablets, pellets and microparticles
International Journal of Pharmaceutics, Volume 585, 30 July 2020, 119562
Nathan Scott, Kavil Patel, Tariro Sithole, Konstantina Xenofontos, Valentyn Mohylyuk, Fang Liu
Research article
Measuring segregation characteristics of industrially relevant granular mixtures: Part II – Experimental application and validation
Powder Technology, Volume 368, 15 May 2020, Pages 278-285
Alexander M. Fry, Vidya Vidyapati, John P. Hecht, Paul B. Umbanhowar, Julio M. Ottinoa, Richard M. Lueptow
Research article
Non-uniform drug distribution matrix system (NUDDMat) for zero-order release of drugs with different solubility
International Journal of Pharmaceutics, Volume 581, 15 May 2020, 119217
Matteo Cerea, Anastasia Foppoli, Luca Palugan, Alic Melocchi, Lucia Zema, Alessandra Maroni, Andrea Gazzaniga
Research article
Effects of humidity on cellulose pellets loaded with potassium titanium oxide oxalate for detection of hydrogen peroxide vapor in powders
Powder Technology, Volume 366, 15 April 2020, Pages 348-357
Maria H. Kastvig, Cosima Hirschberg, Frans W.J. Van Den Berg, Jukka Rantanen, Mogens L. Andersen
Research article
In-line particle size measurement and process influences on rotary fluidized bed agglomeration
Powder Technology, Volume 364, 15 March 2020, Pages 673-679
Marcel Langner, Ivonne Kitzmann, Anna-Lena Ruppert, Inken Wittich, Bertram Wolf
Research article
Recent advance in delivery system and tissue engineering applications of chondroitin sulfate
Carbohydrate Polymers, Volume 230, 15 February 2020, 115650
Jun Yang, Mingyue Shen, Huiliang Wen, Yu Luo, Rong Huang, Liyuan Rong, Jianhua Xie
Research article
Fixed-bed-column studies for Methylene blue removal by Cellulose CELLETS
Environmental Engineering and Management Journal, Volume 19 (2), March 2020, 269-279
Iulia Nica, Gabriela Biliuta, Carmen Zaharia, Lacramioara Rusu, Sergiu Coseri, Daniela Suteu
Research article
Optimization and tracking of coating processes of pellets with polyvinylpyrrolidone solutions in an acoustic levitator
Powder Technology, Volume 360, 15 January 2020, Pages 1126-1133
Doris L. Wong, Anna-Lena Wirsching, Kai Betz, Andreas Reinbeck, Hans-Ulrich Moritz, Werner Pauer
List – Publications with MCC spheres, 2019
Research article
A regenerable microporous adsorbent based on microcrystalline cellulose for organic pollutants adsorption
Desalination and Water Treatment Volume 146, April 2019, Pages 176-187
Daniela Suteu, Gabriela Biliuta, Lacramioara Rusu, Sergiu Coseri, Christophe Vial, Iulia Nica (Nebunu)
Research article
Measurement of hydrogen peroxide vapor in powders with potassium titanium oxide oxalate loaded cellulose pellets as probes
AAPS PharmSciTech, Volume 21(1):3, 11 Nov 2019
Maria H. Kastvig, Johan P. Bøtker, Ge Ge, Mogens L. Andersen
Research article
Wurster Fluidised Bed Coating of Microparticles: Towards Scalable Production of Oral Sustained-Release Liquid Medicines for Patients with Swallowing Difficulties
AAPS PharmSciTech, Volume 21(1):3, 11 Nov 2019
Valentyn Mohylyuk, Kavil Patel, Nathan Scott, Craig Richardson, Darragh Murnane, Fang Liu
Research article
Assessment of the effect of Cellets’ particle size on the flow in a Wurster fluid-bed coater via powder rheology
Journal of Drug Delivery Science and Technology, 54, December 2019, 101320; doi: 10.1016/j.jddst.2019.101320
Valentyn Mohylyuk, Ioanna Danai Styliari, Dmytryi Novykov, Reiss Pikett, Rajeev Dattani
Research article
Particle electrification in an apparatus with a draft tube operating in a fast circulating dilute spout-fluid bed regime
Particuology, Volume 42, February 2019, Pages 146-153
Wojciech Ludwig
Research article
Development and evaluation of budesonide-based modified-release liquid oral dosage forms
Journal of Drug Delivery Science and Technology, Volume 54, December 2019, 101273
Federica Ronchi, Antonio Sereno, Maxime Paide, Ismaël Hennia, Pierre Sacré, George Guillaume, Vincent Stéphenne, Jonathan Goole, Karim Amighi
Research article
Evaluation of in-line particle measurement with an SFT-probe as monitoring tool for process automation using a new time-based buffer approach
European Journal of Pharmaceutical Sciences, Volume 128, 1 February 2019, Pages 162-170
Theresa Reimers, Jochen Thies, Stefan Dietrich, Julian Quodbach, Miriam Pein-Hackelbusch
Research article
In vitro and sensory tests to design easy-to-swallow multi-particulate formulations
European Journal of Pharmaceutical Sciences, Volume 132, 30 April 2019, Pages 157-162
Marco Marconati, Felipe Lopez, Catherine Tuleu, Mine Orlu, Marco Ramaioli
Research article
Numerical study of the hydrodynamics of fluidized beds operated under sub-atmospheric pressure
Chemical Engineering Journal, Volume 372, 15 September 2019, Pages 1134-1153
Sayali Zarekar, Andreas Bück, Michael Jacob, Evangelos Tsotsas
Research article
Solidification of carvedilol loaded SMEDDS by swirling fluidized bed pellet coating
International Journal of Pharmaceutics, Volume 566, 20 July 2019, Pages 89-100
J. Mandić, M. Luštrik, F. Vrečer, M. Gašperlin, A. Zvonar Pobirk
Research article
Quantitative bin flow analysis of particle discharge using X-ray radiography
Powder Technology, Volume 344, 15 February 2019, Pages 693-705
Sanket Bacchuwar, Vidya Vidyapati, Ke-ming Quan, Chen-Luh Lin, Jan D. Miller
Research article
Adjustment of triple shellac coating for precise release of bioactive substances with different physico-chemical properties in the ileocolonic region
International Journal of Pharmaceutics, Volume 564, 10 June 2019, Pages 472-484>
Eva-Maria Theismann, Julia Katharina Keppler, Jörg-Rainer Knipp, Daniela Fangmann, Esther Appel, Stanislav N. Gorb, Georg H. Waetzig, Stefan Schreiber, Matthias Laudes, Karin Schwarz
Research article
The analysis of the influence of the normal restitution coefficient model on calculated particles velocities by means of Eulerian-Lagrangian approach
Powder Technology, Volume 344, 15 February 2019, Pages 140-151
Wojciech Ludwig, PaweƚPłuszka
Research article
Measurement of granule layer thickness in a spouted bed coating process via optical coherence tomography
Powder Technology, Volume 356, November 2019, Pages 139-147
Swantje Pietsch, Anna Peter, Patrick Wahl, Johannes Khinast, Stefan Heinrich
Research article
A novel method of quantifying the coating progress in a three-dimensional prismatic spouted bed
Particuology, Volume 42, February 2019, Pages 137-145
Swantje Pietsch, Finn Ole Poppinga, Stefan Heinrich, Michael Müller, Michael Schönherr, Frank Kleine Jäger
Research article
Development and evaluation of an omeprazole-based delayed-release liquid oral dosage form
International Journal of Pharmaceutics, Volume 567, 15 August 2019, 118416
Federica Ronchi, Antonio, Sereno, Maxime Paide, Pierre Sacré, George Guillaume, Vincent Stéphenne, Jonathan Goole, Karim Amighi
Research article
Influence of separation properties and processing strategies on product characteristics in continuous fluidized bed spray granulation
Powder Technology, Volume 342, 15 January 2019, Pages 572-584
Daniel Müller, Andreas Bück, Evangelos Tsotsas
List – Publications with MCC spheres, 2018
Short communication
Novel production method of tracer particles for residence time measurements in gas-solid processes
Powder Technology, Volume 338, October 2018, Pages 1-6
Swantje Pietsch, Paul Kieckhefen, Michael Müller, Michael Schönherr, Frank Kleine Jäger, Stefan Heinrich
Research article
The effect of administration media on palatability and ease of swallowing of multiparticulate formulations
International Journal of Pharmaceutics, Volume 551, Issues 1–2, 15 November 2018, Pages 67-75
Felipe L. Lopez, Terry B. Ernest, Mine Orlu, CatherineTuleu
Research article
Exploring a Modern Control Strategy for Wurster Coating
Pharmaceutical Technology, 2018, 43(8), 453
E. Godek, C. O’Callaghan, I. Jones, P. Patel
Research article
Compressibility and tablet forming ability of bimodal granule mixtures: Experiments and DEM simulations
International Journal of Pharmaceutics, Volume 540, Issues 1–2, 5 April 2018, Pages 120-131
Josefina Nordström, Göran Alderborn, Göran Frenning
Research article
Effects of pharmaceutical processes on the quality of ethylcellulose coated pellets: Quality by design approach
Powder Technology, Volume 339, November 2018, Pages 25-38
Prakash Thapa, Ritu Thapa, Du Hyung Choi, Seong Hoon Jeong
Research article
Euler-Lagrange model of particles circulation in a spout-fluid bed apparatus for dry coating
Powder Technology, Volume 328, 1 April 2018, Pages 375-388
Wojciech Ludwig, Paweł Płuszka
Research article
Inline acoustic monitoring to determine fluidized bed performance during pharmaceutical coating
International Journal of Pharmaceutics, Volume 549, Issues 1–2, 5 October 2018, Pages 293-298
Allan Carter, Lauren Briens
Research article
Sifting segregation of ideal blends in a two-hopper tester: Segregation profiles and segregation magnitudes
Powder Technology, Volume 331, 15 May 2018, Pages 60-67
Mariagrazia Marucci, Banien Al-Saaigh, Catherine Boissier, Marie Wahlgren, Håkan Wikström
Conference abstract
Multiple unit mini-tablets: Content uniformity issues
International Journal of Pharmaceutics, Volume 536, Issue 2, 5 February 2018, Pages 506-507
Anna Kira Adam, Jörg Breitkreutz
Research article
Influence of gas inflow modelling on CFD-DEM simulations of three-dimensional prismatic spouted beds
Powder Technology, Volume 329, 15 April 2018, Pages 167-180
Paul Kieckhefen, Swantje Pietsch, Moritz Höfert, Michael Schönherr, Stefan Heinrich, Frank Kleine Jäger
Research article
A redispersible dry emulsion system with simvastatin prepared via fluid bed layering as a means of dissolution enhancement of a lipophilic drug
International Journal of Pharmaceutics, Volume 549, Issues 1–2, 5 October 2018, Pages 325-334
Mitja Pohlen, Luka Pirker, Matevž Luštrik, Rok Dreu
Review article
Overview of PAT process analysers applicable in monitoring of film coating unit operations for manufacturing of solid oral dosage forms
European Journal of Pharmaceutical Sciences, Volume 111, 1 January 2018, Pages 278-292
Klemen Korasa, Franc Vrečer
Research article
On the properties and application of beeswax, carnauba wax and palm fat mixtures for hot melt coating in fluidized beds
Advanced Powder Technology, Volume 29, Issue 3, March 2018, Pages 781-788
M.G. Müller, J.A. Lindner, H. Briesen, K. Sommer, P. Foerst
Research article
Novel hydrophilic matrix system with non-uniform drug distribution for zero-order release kinetics
Journal of Controlled Release, Volume 287, 10 October 2018, Pages 247-256
Matteo Cerea, Alessandra Maroni, Luca Palugan, Marco Bellini, Anastasia Foppoli, Alice Melocchi, Lucia Zema, Andrea Gazzaniga
Research article
Role of plasticizer in membrane coated extended release oral drug delivery system
Journal of Drug Delivery Science and Technology, Volume 44, April 2018, Pages 231-243
Pinak Khatri, Dipen Desai, Namdev Shelke, Tamara Minko
Research article
Evaluation of pellet cycle times in a Wurster chamber using a photoluminescence method
Chemical Engineering Research and Design, Volume 132, April 2018, Pages 1170-1179
Domen Kitak, Rok Šibanc, Rok Dreu
Research article
Influence of perforated draft tube air intake on a pellet coating process
Powder Technology, Volume 330, 1 May 2018, Pages 114-124
Matevž Luštrik, Rok Dreu, Matjaž Perpar
Research article
Optimising the in vitro and in vivo performance of oral cocrystal formulations via spray coating
European Journal of Pharmaceutics and Biopharmaceutics, Volume 124, March 2018, Pages 13-27
Dolores R. Serrano, David Walsh, Peter O’Connell, Naila A. Mugheirbi, Zelalem Ayenew Worku, Francisco Bolas-Fernandez, Carolina Galiana, Maria Auxiliadora Dea-Ayuela, Anne Marie Healy
Research article
Mechanics of Pharmaceutical Pellets—Constitutive Properties, Deformation, and Breakage Behavior
Journal of Pharmaceutical Sciences, Volume 107, Issue 2, February 2018, Pages 571-586
Alexander Russell, Rok Šibanc, Rok Dreu, Peter Müller
List – Publications with MCC spheres, 2017
Research article
Production of composite particles using an innovative continuous dry coating process derived from extrusion
Advanced Powder Technology, Volume 28, Issue 11, November 2017, Pages 2875-2885
Fanny Cavaillès, Romain Sescousse, Alain Chamayou, Laurence Galet
Research article
Determination of the release mechanism of Theophylline from pellets coated with Surelease®—A water dispersion of ethyl cellulose
International Journal of Pharmaceutics, Volume 528, Issues 1–2, 7 August 2017, Pages 345-353
Jurgita Kazlauske, Maria Margherita Cafaro, Diego Caccavo, Mariagrazia Marucci, Gaetano Lamberti, Anna Angela Barba, Anette Larsson
Research article
In-line monitoring of multi-layered film-coating on pellets using Raman spectroscopy by MCR and PLS analyses
European Journal of Pharmaceutics and Biopharmaceutics, Volume 114, May 2017, Pages 194-201
Jin Hisazumi, Peter Kleinebudde
Research article
Analysis of pellet coating uniformity using a computer scanner
International Journal of Pharmaceutics, Volume 533, Issue 2, 30 November 2017, Pages 377-382
Rok Šibanc, Matevž Luštrik, Rok Dreu
Research article
Modeling of particle velocities in an apparatus with a draft tube operating in a fast circulating dilute spout-fluid bed regime
Powder Technology, Volume 319, September 2017, Pages 332-345
Wojciech Ludwig, Daniel Zając
Research article
UV imaging of multiple unit pellet system (MUPS) tablets: A case study of acetylsalicylic acid stability
European Journal of Pharmaceutics and Biopharmaceutics, Volume 119, October 2017, Pages 447-453
Anna Novikova, Jens M. Carstensen, Thomas Rades, Claudia S. Leopold
Research article
Influence of Water on the Structure and Dielectric Properties of the Microcrystalline and Nano-Cellulose
Nanoscale Res Lett 12, 468 (2017); doi: 10.1186/s11671-017-2231-5
Kovalov, K.M., Alekseev, O.M., Lazarenko, M.M.
Research article
New hybrid CPU-GPU solver for CFD-DEM simulation of fluidized beds
Powder Technology, Volume 316, 1 July 2017, Pages 233-244
H.R. Norouzi, R. Zarghami, N. Mostoufi
Research article
A top coating strategy with highly bonding polymers to enable direct tableting of multiple unit pellet system (MUPS)
Powder Technology, Volume 305, January 2017, Pages 591-596
Frederick Osei-Yeboah, Yidan Lan, Changquan Calvin Sun
Research article
Synthesis and melt processing of cellulose esters for preparation of thermoforming materials and extended drug release tablets
Carbohydrate Polymers, Volume 177, 1 December 2017, Pages 105-115
Sanna Virtanen, Riku Talja, Sauli Vuoti
Research article
Downstream drug product processing of itraconazole nanosuspension: Factors influencing drug particle size and dissolution from nanosuspension-layered beads
International Journal of Pharmaceutics, Volume 524, Issues 1–2, 30 May 2017, Pages 443-453
Johannes Parmentier, En Hui Tan, Ariana Low, Jan Peter Möschwitzer
List – Publications with MCC spheres, 2016
Research article
In-line particle size measurement and agglomeration detection of pellet fluidized bed coating by Spatial Filter Velocimetry
Powder Technology, Volume 301, November 2016, Pages 261-267
Dimitri Wiegel, Günter Eckardt, Florian Priese, Bertram Wolf
Research article
Effect of formulation variables on oral grittiness and preferences of multiparticulate formulations in adult volunteers
European Journal of Pharmaceutical Sciences, Volume 92, 20 September 2016, Pages 156-162
Felipe L. Lopez, Alexandra Bowles, Mine Orlu Gul, David Clapham, Terry B. Ernest, Catherine Tuleu
Research article
Micropellet-loaded rods with dose-independent sustained release properties for individual dosing via the Solid Dosage Pen
International Journal of Pharmaceutics, Volume 499, Issues 1–2, 29 February 2016, Pages 271-279
Eva Julia Laukamp, Klaus Knop, Markus Thommes, Joerg Breitkreutz
Research article
Multivariate calibration of the degree of crystallinity in intact pellets by X-ray powder diffraction
International Journal of Pharmaceutics, Volume 502, Issues 1–2, 11 April 2016, Pages 107-116
Krisztina Nikowitz, Attila Domján, Klára Pintye-Hódi, Géza Regdon jr.
Research article
Towards improving quality of video-based vehicle counting method for traffic flow estimation
Signal Processing, Volume 120, March 2016, Pages 672-681
Yingjie Xia, Xingmin Shi, Guanghua Song, Qiaolei Geng, Yuncai Liu
Conference abstract
Multiple-unit orodispersible mini-tablets
International Journal of Pharmaceutics, Volume 511, Issue 2, 25 September 2016, Page 1128
Anna Kira Adam, Christian Zimmer, Stefan Rauscher, Jörg Breitkreutz
Research article
Asymmetric distribution in twin screw granulation
European Journal of Pharmaceutics and Biopharmaceutics, Volume 106, September 2016, Pages 50-58
Tim Chan Seem, Neil A. Rowson, Ian Gabbott, Marcelde Matas, Gavin K. Reynolds, AndyIngram
Research article
Measurement of particle concentration in a Wurster coater draft tube using light attenuation
Chemical Engineering Research and Design, Volume 110, June 2016, Pages 20-31
R. Šibanc, I. Žun, R. Dreu
List – Publications with MCC spheres, 2015
Research article
Two-dimensional particle shape analysis from chord measurements to increase accuracy of particle shape determination
Powder Technology, Volume 284, November 2015, Pages 25-31
D. Petrak, S. Dietrich, G. Eckardt, M. Köhler
Research article
Passive acoustic emission monitoring of pellet coat thickness in a fluidized bed
Powder Technology, Volume 286, December 2015, Pages 172-180
Taylor Sheahan, Lauren Briens
Research article
Tabletability Modulation Through Surface Engineering
Journal of Pharmaceutical Sciences, Volume 104, Issue 8, August 2015, Pages 2645-2648
Frederick Osei-Yeboah, Changquan Calvin Sun
Research article
Cellulose CELLETS as new type of adsorbent for the removal of dyes from aqueous media
Environmental Engineering and Management Journal, Volume 14, Issue 3, March 2015, Pages 525-532
Daniela Suteu, Gabriela Biliuta, Lacramioara Rusu, Sergiu Coseri, Gabriela Nacu
Research article
Formulation and process optimization of multiparticulate pulsatile system delivered by osmotic pressure-activated rupturable membrane
International Journal of Pharmaceutics, Volume 480, Issues 1–2, 1 March 2015, Pages 15-26
Sheng-Feng Hung, Chien-Ming Hsieh, Ying-Chen Chen, Cheng-Mao Lin, Hsiu-O Ho, Ming-Thau Sheu
Research article
Dry Coating Characterization of Coverage by Image Analysis: Methodology
Procedia Engineering, Volume 102, 2015, Pages 81-88
Olivier Lecoq, Fredj Kaouach, Alain Chamayou
Research article
Passive acoustic emissions monitoring of the coating of pellets in a fluidized bed—A feasibility analysis
Powder Technology, Volume 283, October 2015, Pages 373-379
Taylor Sheahan, Lauren Briens
List – Publications with MCC spheres, 2014
Research article
A New Apparatus for Real‐Time Assessment of the Particle Size Distribution of Disintegrating Tablets
Journal of Pharmaceutical Sciences, Volume 103, Issue 11, November 2014, Pages 3657-3665
Julian Quodbach, Peter Kleinebudde
Research article
In-line spatial filtering velocimetry for particle size and film thickness determination in fluidized-bed pellet coating processes
European Journal of Pharmaceutics and Biopharmaceutics, Volume 88, Issue 3, November 2014, Pages 931-938
Friederike Folttmann, Klaus Knop, Peter Kleinebudde, Miriam Pein
Research article
On-line monitoring of fluid bed granulation by photometric imaging
European Journal of Pharmaceutics and Biopharmaceutics, Volume 88, Issue 3, November 2014, Pages 879-885
Ira Soppela, Osmo Antikainen, Niklas Sandler, Jouko Yliruusi
Research article
Application properties of oral gels as media for administration of minitablets and pellets to paediatric patients
International Journal of Pharmaceutics
Volume 460, Issues 1–2, 2 January 2014, Pages 228-233
Anna Kluk, Malgorzata Sznitowska
Research article
In-line monitoring of pellet coating thickness growth by means of visual imaging
International Journal of Pharmaceutics, Volume 470, Issues 1–2, 15 August 2014, Pages 8-14
Nika Oman Kadunc, Rok Šibanc, Rok Dreu, Boštjan Likar, Dejan Tomaževič
Research article
Optical microscopy as a comparative analytical technique for single-particle dissolution studies
International Journal of Pharmaceutics, Volume 469, Issue 1, 20 July 2014, Pages 10-16
Sami Svanbäck, Henrik Ehlers, Jouko Yliruusi
Research article
Formulation of itraconazole nanococrystals and evaluation of their bioavailability in dogs
European Journal of Pharmaceutics and Biopharmaceutics, Volume 87, Issue 1, May 2014, Pages 107-113
Lieselotte De Smet, Lien Saerens, Thomas De Beer, Robert Carleer, Peter Adriaensens, Jan Van Bocxlaer, Chris Vervaet, Jean PaulRemon
Research article
Global monitoring of fluidized-bed processes by means of microwave cavity resonances
Measurement, Volume 55, September 2014, Pages 520-535
Johan Nohlert, Livia Cerullo, Johan Winges, Thomas Rylander, Tomas McKelvey, Anders Holmgren, Lubomir Gradinarsky, Staffan Folestad, Mats Viberg, Anders Rasmuson
List – Publications with MCC spheres, 2013
Research article
Water-mediated solid-state transformation of a polymorphic drug during aqueous-based drug-layer coating of pellets
International Journal of Pharmaceutics, Volume 456, Issue 1, 1 November 2013, Pages 41-48
Andres Lust, Satu Lakio, Julia Vintsevits, Jekaterina Kozlova, Peep Veski, Jyrki Heinämäki, Karin Kogermann
Research article
Preparation and characterization of controlled-release doxazosin mesylate pellets using a simple drug layering-aquacoating technique
Journal of Pharmaceutical Investigation (2013), 43:333–342. doi: 10.1007/s40005-013-0077-0
H. A. Hazzah, M. A. EL-Massik, O. Y. Abdallah & H. Abdelkader
Research article
Development of high drug loaded pellets by Design of Experiment and population balance model calculation
Powder Technology, Volume 241, June 2013, Pages 149-157
Florian Priese, Bertram Wolf
Research article
Particle sizing measurements in pharmaceutical applications: Comparison of in-process methods versus off-line methods
European Journal of Pharmaceutics and Biopharmaceutics, Volume 85, Issue 3, Part B, November 2013, Pages 1006-1018
Ana F.T. Silva, Anneleen Burggraeve, Quenten Denon, Paul Van der Meeren, Niklas Sandler, Tom Van Den Kerkhof, Mario Hellings, Chris Vervaet, Jean Paul Remon, João Almeida Lopes, Thomas De Beer
Research article
Physical properties of pharmaceutical pellets
Chemical Engineering Science, Volume 86, 4 February 2013, Pages 50-60
Rok Šibanc, Teja Kitak, Biljana Govedarica, StankoSrčič Rok Dreu
Research article
Continuous pellet coating in a Wurster fluidized bed process
Chemical Engineering Science, Volume 86, 4 February 2013, Pages 87-98
N. Hampel, A. Bück, M. Peglow, E. Tsotsas
Research article
Study of the recrystallization in coated pellets – Effect of coating on API crystallinity
European Journal of Pharmaceutical Sciences, Volume 48, Issue 3, 14 February 2013, Pages 563-571
Krisztina Nikowitz, Klára Pintye-Hódi, Géza Regdon Jr.
Research article
The influence of rolling friction on the shear behaviour of non-cohesive pharmaceutical granules – An experimental and numerical investigation
European Journal of Pharmaceutical Sciences, Volume 49, Issue 2, 13 May 2013, Pages 241-250
Ann-Sofie Persson, Göran Frenning
Research article
Characteristics of pellet flow in a Wurster coater draft tube utilizing piezoelectric probe
Powder Technology, Volume 235, February 2013, Pages 640-651
Matevž Luštrik, Rok Šibanc, Stanko Srčič, Matjaž Perpar, Iztok Žun, Rok Dreu
Research article
Estimating coating quality parameters on the basis of pressure drop measurements in a Wurster draft tube
Powder Technology, Volume 246, September 2013, Pages 41-50
Matjaž Perpar, Matevž Luštrik, Rok Dreu, Stanko Srčič, Iztok Žun
Research article
Influence of Non-Water-Soluble Placebo Pellets of Different Sizes on the Characteristics of Orally Disintegrating Tablets Manufactured by Freeze-Drying
Journal of Pharmaceutical Sciences, Volume 102, Issue 6, June 2013, Pages 1786-1799
Ulrike Stange, Christian Führling, Henning Gieseler
List – Publications with MCC spheres, 2012
Research article
A density-based segmentation for 3D images, an application for X-ray micro-tomography
Analytica Chimica Acta, Volume 725, 6 May 2012, Pages 14-21
Thanh N. Tran, Thanh T. Nguyen, Tofan A. Willemsz, Gijsvan Kessel, Henderik W. Frijlink, Kees van der Voort Maarschalk
Research article
Attrition and abrasion resistance of particles coated with pre-mixed polymer coating systems
Powder Technology, Volume 230, November 2012, Pages 1-13
G. Perfetti, F. Depypere, S. Zafari, P. van Hee, W.J. Wildeboer, G. M. H. Meesters
Research article
New spout-fluid bed apparatus for electrostatic coating of fine particles and encapsulation
Powder Technology, Volume 225, July 2012, Pages 52-57
Roman G. Szafran, Wojciech Ludwig, Andrzej Kmiec
Research article
Particle size and packing characterization by diffuse light transmission
Particuology Volume 10, Issue 5, October 2012, Pages 619-627
Henrik Ehlers, Jyrki Heinämäki, Jouko Yliruusi
Research article
Dry Powder Coating in a Modified Wurster Apparatus
Procedia Engineering, Volume 42, 2012, Pages 437-446
W. Ludwig, R.G. Szafran, A. Kmiec, J. Dziak
Research article
Attrition strength of water-soluble cellulose derivative coatings applied on different core materials
Powder Technology, Volume 222, May 2012, Pages 71-79
Katarzyna Nienaltowska, Frédéric Depypere, Giacomo Perfetti, Gabrie M.H. Meesters, Frederik Ronsse, Jan G. Pieters, Koen Dewettinck
Research article
An experimental evaluation of the accuracy to simulate granule bed compression using the discrete element method
Powder Technology, Volume 219, March 2012, Pages 249-256
Ann-Sofie Persson, Göran Frenning
List – Publications with MCC spheres, 2011
Research article
Understanding Fluidized-Bed Granulation
Pharmaceutical Technology 35 (8), 2011, 63-67
A. Burggraeve, T. Van Den Kerkhof, M. Hellings, J.P. Remon, C. Vervaet, T. De Beer
Research article
Dry particle high coating of biopowders: An energy approach
Powder Technology, Volume 208, Issue 2, 25 March 2011, Pages 378-382
S. Otles, O. Lecoq, J. A. Dodds
Research article
A density based segmentation method to determine the coordination number of a particulate system
Chemical Engineering Science, Volume 66, Issue 24, 15 December 2011, Pages 6385-6392
Thanh T. Nguyen, Thanh N. Tran, Tofan A. Willemsz, Henderik W. Frijlink, Tuomas Ervasti, Jarkko Ketolainen, Kees van der Voort Maarschalk
Research article
Study of the preparation of a multiparticulate drug delivery system with a layering technique
Powder Technology, Volume 205, Issues 1–3, 10 January 2011, Pages 155-159
Krisztina Nikowitz, Péter Kása Jr., Klára Pintye-Hódi, Géza Regdon Jr.
Research article
Effect of annealing time and addition of lactose on release of a model substance from Eudragit® RS coated pellets produced by a fluidized bed coater
Chemical Engineering Research and Design, Volume 89, Issue 6, June 2011, Pages 697-705
Ulrich M. Heckötter, Anette Larsson, Pornsak Sriamornsak, Mont Kumpugdee-Vollrath
Research article
Suspension pellet layering using PVA–PEG graft copolymer as a new binder
International Journal of Pharmaceutics, Volume 412, Issues 1–2, 30 June 2011, Pages 28-36
L. Suhrenbrock, G. Radtke, K. Knop, P. Kleinebudde
Research article
In-line particle sizing for real-time process control by fibre-optical spatial filtering technique (SFT)
Advanced Powder Technology, Volume 22, Issue 2, March 2011, Pages 203-208
Petrak Dieter, Dietrich Stefan, Eckardt Günter, Köhler Michael
Research article
Flowability of surface modified pharmaceutical granules: A comparative experimental and numerical study
European Journal of Pharmaceutical Sciences, Volume 42, Issue 3, 14 February 2011, Pages 199-209
Ann-Sofie Persson, Göran Alderborn, Göran Frenning
List – Publications with MCC spheres, 2010
Research article
Labscale fluidized bed granulator instrumented with non-invasive process monitoring devices
Chemical Engineering Journal, Volume 164, Issues 2–3, 1 November 2010, Pages 268-274
Jari T. T. Leskinen, Matti-Antero H. Okkonen, Maunu M. Toiviainen, Sami Poutiainen, Mari Tenhunen, Pekka Teppola, Reijo Lappalainen, Jarkko Ketolainen, Kristiina Järvinen
Research article
X-ray micro tomography and image analysis as complementary methods for morphological characterization and coating thickness measurement of coated particles
Advanced Powder Technology, Volume 21, Issue 6, November 2010, Pages 663-675
Giacomo Perfetti, Elke Van de Casteele, Bernd Rieger, Willem J. Wildeboer, Gabrie M.H. Meesters
Research article
New insights into segregation during tabletting
International Journal of Pharmaceutics, Volume 397, Issues 1–2, 15 September 2010, Pages 19-26
S. Lakio, S. Siiriä, H. Räikkönen, S. Airaksinen, T. Närvänen, O. Antikainen, J.Yliruusi
Research article
Evaluation of in-line spatial filter velocimetry as PAT monitoring tool for particle growth during fluid bed granulation
European Journal of Pharmaceutics and Biopharmaceutics, Volume 76, Issue 1, September 2010, Pages 138-146
A. Burggraeve, T. Van Den Kerkhof, M. Hellings, J.P. Remon, C. Vervaet, T. De Beera
Research article
Granule size distribution of tablets
Journal of Pharmaceutical Sciences, Volume 99, Issue 4, April 2010, Pages 2061-2069
Satu Virtanen, Osmo Antikainen, Heikki Räikkönen, Jouko Yliruusi
Research article
Colorful Drying
AAPS PharmSciTech 11, 46–53 (2010); doi: 10.1208/s12249-009-9351-x
S. Lakio, J. Heinämäki, J. Yliruusi
Short communication
Can encapsulation lengthen the shelf-life of probiotic bacteria in dry products?
International Journal of Food Microbiology, Volume 136, Issue 3, 1 January 2010, Pages 364-367
F. Weinbreck, I. Bodnár, M.L. Marco
List – Publications with MCC spheres, 2009
Research article
Impact of polymers on dissolution performance of an amorphous gelleable drug from surface-coated beads
European Journal of Pharmaceutical Sciences, Volume 37, Issue 1, 11 April 2009, Pages 1-10
Chon gFan, Rashmi Pai-Thakur, Wantanee Phuapradit, Lin Zhang, Hung Tian, Waseem Malick, Navnit Shah, M. Serpil Kislalioglu
Short communication
Raman spectroscopic investigation of film thickness
Polymer Testing, Volume 28, Issue 7, October 2009, Pages 770-772
T. Sovány, K. Nikowitz, G. Regdon Jr., P. Kása Jr., K. Pintye-Hódi
Research article
In vivo evaluation of the vaginal distribution and retention of a multi-particulate pellet formulation
European Journal of Pharmaceutics and Biopharmaceutics, Volume 73, Issue 2, October 2009, Pages 280-284
Nele Poelvoorde, Hans Verstraelen, Rita Verhelst, Bart Saerens, Ellen De Backer, Guido Lopes dos Santos Santiago, Chris Vervaet, Mario Vaneechoutte, Fabienne De Boeck, Luc Van Borteld, Marleen Temmerman, Jean-Paul Remon
Research article
Modulating pH-independent release from coated pellets: Effect of coating composition on solubilization processes and drug release
European Journal of Pharmaceutics and Biopharmaceutics, Volume 72, Issue 1, May 2009, Pages 111-118
Simon Ensslin, Klaus Peter Moll, Hendrik Metz, Markus Otz, Karsten Mäder
Research article
Dry Particle High-Impact Coating of Biopowders: Coating Strength
Particulate Science and Technology, Volume 27(4), 2009
S. Ötles, O. Lecoq, J. A. Dodds
Book
Formulation and Analytical Development for Low-Dose Oral Drug Products
John Wiley & Sons , inc. (2009), ISBN 978-0-470-05609-7
Jack Zheng (Editor)
List – Publications with MCC spheres, 2008 and earlier
Research article
Attrition strength of different coated agglomerates
Chemical Engineering Science, Volume 63, Issue 5, March 2008, Pages 1361-1369
B. van Laarhoven, S.C.A. Wiers, S.H. Schaafsma, G.M.H. Meesters
Research article
Direct Drug Loading into Preformed Porous Solid Dosage Units by the Controlled Particle Deposition (CPD), a New Concept for Improved Dissolution Using SCF-Technology
Journal of Pharmaceutical Sciences, Volume 97, Issue 10, October 2008, Pages 4416-4424
Ragna S. Wischumerski, Michael Türk, Martin A. Wahl
Research article
Optimisation of an enteric coated, layered multi-particulate formulation for ileal delivery of viable recombinant Lactococcus lactis
European Journal of Pharmaceutics and Biopharmaceutics, Volume 69, Issue 3, August 2008, Pages 969-976
Nele Poelvoorde, Nathalie Huyghebaert, Chris Vervaet, Jean-Paul Remon
Research article
Dynamic rearrangement of disulfide bridges influences solubility of whey protein coatings
International Dairy Journal, Volume 18, Issue 5, May 2008, Pages 566-573
René Floris, Igor Bodnár, Fanny Weinbreck, Arno C. Alting
Research article
New insight into modified release pellets – Internal structure and drug release mechanism
Journal of Controlled Release, Volume 128, Issue 2, 4 June 2008, Pages 149-156
Simon Ensslin, Klaus Peter Moll, Kurt Paulus, Karsten Mäder
Research article
Development of an enteric-coated, layered multi-particulate formulation for ileal delivery of viable recombinant Lactococcus lactis
European Journal of Pharmaceutics and Biopharmaceutics, Volume 61, Issue 3, October 2005, Pages 134-141
Nathalie Huyghebaert, An Vermeire, Pieter Rottiers, Erik Remaut, Jean Paul Remon
Research article
Evaluation of extrusion/spheronisation, layering and compaction for the preparation of an oral, multi-particulate formulation of viable, hIL-10 producing Lactococcus lactis
European Journal of Pharmaceutics and Biopharmaceutics, Volume 59, Issue 1, January 2005, Pages 9-15
Nathalie Huyghebaert, An Vermeire, Sabine Neirynck, Lothar Steidler, Eric Remaut, Jean Paul Remon
Research article
Liquid absorption capacity of carriers in the food technology
Powder Technology, Volume 134, Issue 3, 30 September 2003, Pages 201-209
Heidi Lankes, Karl Sommer, Bernd Weinreich


 Adobe Firefly