Abstract
Multidimensional Correlation of Surface Smoothness and Process Conditions is a necessary attempt to better understand, optimize and outperform process steps of drug formulations. Particle coating and layering in a fluidized bed process is a main attempt in pharmaceutical industry for drug production for modern oral dosage forms. The precise knowledge of control process parameters leads to high surface control of the drug-loaded particles and therefore is crucial for the quality and yield of production in a more general aspect. This application note presents a multidimensional attempt by Orth et al. [1] to correlate particle surface structure morphology and process conditions in a fluidized bed layering spray granulation. CELLETS® 500 are used as spherical, high-quality starter cores.
About fluidized bed process conditions
Fluidized bed processes are used in pharmaceutical, food and agro industries. Solid particles are transported in a defined gas stream inducing fluidized bed conditions. Solid-containing dispersions or liquids are sprayed onto the fluidized particles. Variable settings of process parameters allow particle layering, coating, coalescence and agglomeration. This point seems to make the fluidized bed becoming a universal process for particle processing, but also requests deeper knowledge about the desired process parameter settings: The goal is a stable, high-quality, high-output process.
Standard process parameters are:
- liquid spray rate (m1)
- fluidization air flow rate (Vair)
- fluidization air temperature (Tin)
- spray air temperature (Tat)
- spray atomization pressure (pat)
Beside the spraying process, also the drying process plays an important role. By drying, moisture, sticky conditions and flowability are strongly influenced. Hampel [2] analyzed in her doctoral thesis the importance of the drying process using CELLETS® 200 as model particles.
Technology, Materials and Analysis
The coating experiments were carried out in a ProCell® 5 LabSystem with the fluidized bed process chamber GF3 (Glatt GmbH, Germany) as shown in Figure 1. The ProCell® 5 LabSystem is designed for testing of spouted bed and fluidized bed processes in the single kg-scale.
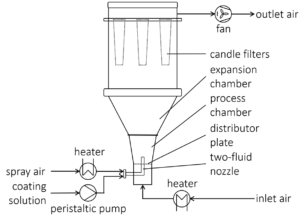
Fig.1: Sketch of the experimental fluidized bed setup (Procell® 5 LabSystem with GF3 chamber).
As Materials, pellets made of 100% microcrystalline cellulose (CELLETS® 500) are employed as perfect starter cores. These pellets provide smooth and defined surface properties, chemical inertness, robustness and a high degree of sphericity. Specific properties of CELLETS® 500 for this study are shown in Table 1. The roughness is at 1.5 µm and therefore delivers perfect initial conditions for controlled spray granulation.
| Property | Value |
| Sauter diameter | 639 µm |
| Sphericity | 0.96 |
| Surface roughness | 1.5 µm |
| Solid density | 1.445 g/cm3 |
Table 1: Properties of CELLETS® 500.
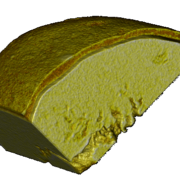
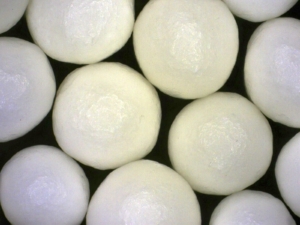
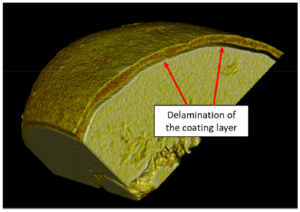
As spray liquid, a 30 wt% sodium benzoate solution was injected into the process chamber. The mass ratio of spray liquid to starter cores was 1:2. Different coating conditions have statistically been driven. In turn, the spray-coated particles show different surface structures (Figure 2a-d).
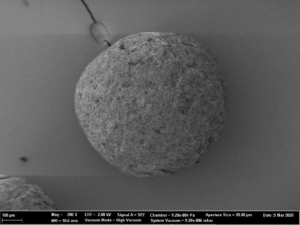
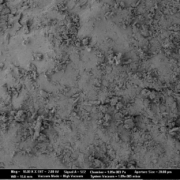
Fig.2a: SEM images of CELLETS® 500 particles coated with sodium benzoate at process conditions as printed in Table 2 (bold).
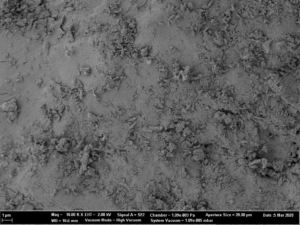
Fig. 2b: Close-up SEM images of CELLETS® 500 particles coated with sodium benzoate at process conditions as printed in Table 2 (bold).
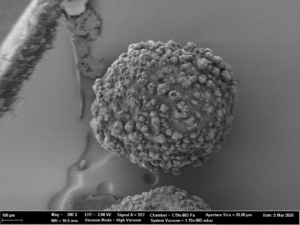
Fig. 2c: SEM images of CELLETS® 500 particles coated with sodium benzoate at process conditions as printed in Table 2 (italic).
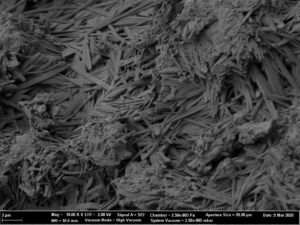
Fig. 2d: Close-up SEM images of CELLETS® 500 particles coated with sodium benzoate at process conditions as printed in Table 2 (italic).
| Parameter | Controlled values |
| liquid spray rate (m1) | 10 | 15 | 20 |
| fluidization air flow rate (Vair) | 80 | 105 | 130 |
| fluidization air temperature (Tin) | 50 | 85 | 120 |
| spray air temperature (Tat) | 20 | 70 | 120 |
| spray atomization pressure (pat) | 0.5 | 1.75 | 3.0 |
Table 2: Process parameters and values used in coating experiments.
The coated particles were analyzed regarding their surface roughness via laser scanning microscopy (VK-X160K, Keyence, Japan). Additional images were obtained with a scanning electron microscope (Supra VP55, Zeiss, Germany).
A 3D-profile of the particle surface was created and evaluated in a defined measurement area. Roughness analysis can be performed through several parameters as defined in DIN EN ISO 4287:2010-07 (2010) and DIN EN ISO 25178-2:2012 (2012). In this attempt, the arithmetical mean height was used as roughness quantifier. The roughness was correlated to the process parameters and the resulting linear correlation was rigorously analyzed using a principal component analysis.
Results
A linear regression model is fitted to the roughness data using the ordinary least squares method. This enables to create a linear model connecting the chosen process parameters to the surface roughness of the coated particles. It is mentionable, that in this attempt the fluidization air flow rate and the spray air temperature did not show a significant effect on the surface structure and were therefore removed from the model.
Process conditions: Influence of the liquid spray rate
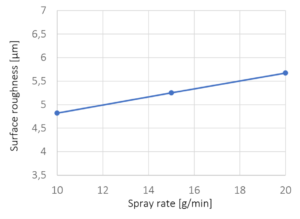
Figure 3: Surface roughness versus liquid spray rate. The crosses mark the experimentally investigated spray rates; line represents a linear interpolation.
The dependence of the surface roughness on the spray rate of the sodium benzoate solution is shown in Figure 3. A slight increase of surface roughness is identified for increasing spray rates. The main effect is considered to be influenced by the crystallization of sodium benzoate. Following, crystallization is higher at higher spray rates caused by lower evaporation due to higher liquid volumes in the process. The dependence of the crystallization of sodium benzoate on the drying conditions during fluidized bed coating was also observed by Rieck et al. [3] and Hoffmann et al. [4].
Process conditions: Influence of the fluidization air inlet temperature
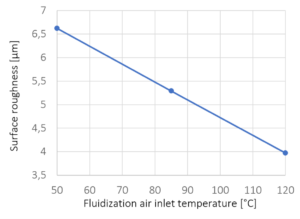
Figure 4: Surface roughness versus fluidization air inlet temperature. The crosses mark the experimentally investigated temperatures; line represents a linear interpolation.
An increase in the fluidization air inlet temperature results in a lower roughness of the coated particles and therefore in a smoother particle surface. The temperature of the fluidization air has a major impact on the drying conditions during the spray granulation process. As an increased temperature causes reduced relative humidity, the heated air can absorb a larger amount of water, which results in a high drying rate. Crystal growth of spray droplets is reduced by fast evaporation times and short drying times.
Process conditions: Influence of the atomization pressure
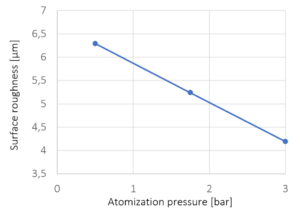
Figure 5: Surface roughness versus spray atomization pressure. The crosses mark the experimentally investigated pressures; line represents a linear interpolation.
With increasing atomization pressure from 0.5 bar to 3.0 bar, the surface roughness is decreasing. The pressure of the spray air strongly influences the droplet size and velocity. With increasing atomization pressure, the droplet size and size distribution decreases while the droplet velocity increases which in causes a more homogeneous spreading and promotes smoother surface coatings.
Summary
CELLETS® 500 are used as model particles for analyzing the surface roughness of coated particles dependent on process conditions in a bottom-spray process. As the results suggest, a high surface roughness is achieved at low fluidization air temperatures, low atomization pressures and high spray rates of the coating solution. Conversely, at high air temperatures, high spray pressures and low liquid spray rates, particles with smooth and compact surfaces are produced.
Acknowledgement
Prof. Stefan Heinrich and his team are gratefully acknowledged for serving content for this note:
![]()
Hamburg University of Technology
Institute of Solids Process Engineering and Particle Technology
Contact: Prof. Dr. Stefan Heinrich
Denickestrasse 15, 21073 Hamburg, Germany
Tel: +49 40 42878 3750
E-mail: stefan.heinrich@tuhh.de
Website: https://www.tuhh.de/spe/
The authors got funding from the German Research Foundation within the DFG Graduate School GRK 2462 “Processes in natural and technical Particle-Fluid-Systems (PintPFS)” (Project No. 390794421) and funding from BASF SE.
CELLETS® 500 were sponsored by HARKE Pharma.
References
[2] N.A. Hampel, Dissertation, Otto-von-Guericke-Universität Magdeburg, 2015. DOI:10.25673/4340