Abstract
Patients with dysphagia may have obstacles to swallow tablets or large multiparticulates. The former dosage form can even not be crushed in case that the tablet exhibits a modified release or taste-masking profile through outer layering. As a solution, so called jelly formulations may be a valuable attempt. Jellies are delivery vehicles incorporating sustained release microparticles for patients with dysphagia. This case study investigates a modified release formulation based on Gliclazide. Gliclazide is used to treat diabetes mellitus type 2. In combination with selected excipients, a jelly-like appearance is composed. Micropellets made of microcrystalline cellulose (Cellets®) are used as API carrier systems.
Goals and Formulation of a Gliclazide drug
The goal is to investigate a revolutionary method for geriatrics with dysphagia or potentially for paediatrics based on jelly-like formulations. The formulation should carry an API such as Gliclazide and show a modified release profile.
Free-standing jellies are formulated by mixing sodium alginate (0.5 % w/v with another polymer, and 1 % w/v w/o polymer), with an aqueous solution of dicalcium phosphate dihydrate (0.1-1 % w/v).
Soft granular jellies are formulated by preparing an aqueous sodium alginate (0.5-2 % w/v) solution with or without the presence of another polymer and by later adding an aqueous calcium chloride solution (0.1-0.3 % w/v).
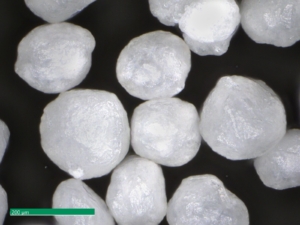
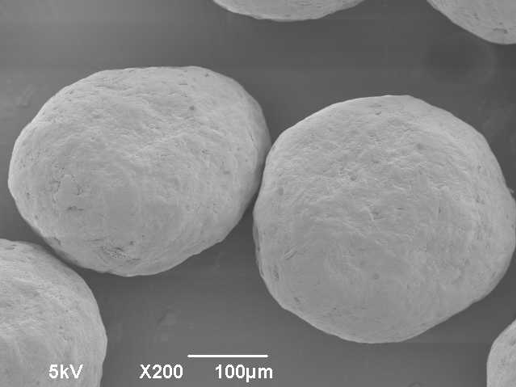
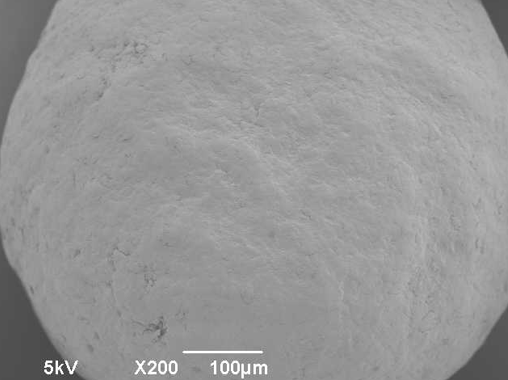
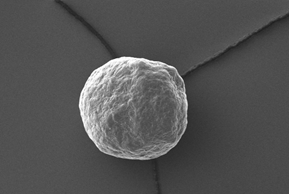
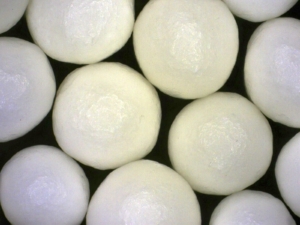
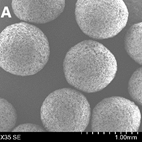
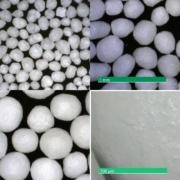
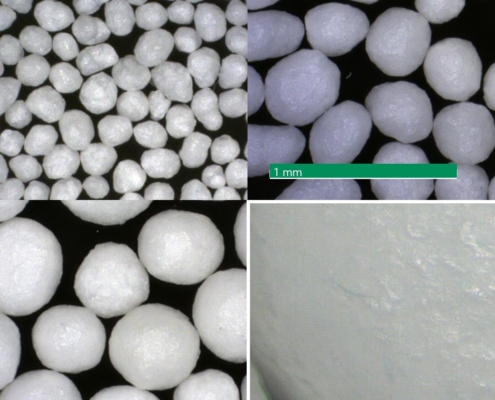
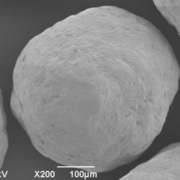
Figure 1: Image of MCC micropellets (Cellets® 100).
MCC micropellets (Cellets® 100, Figure 1) are used as drug carriers. Gliclazide is layered onto the starter beads using a Wurster fluidized bed coater (Mini-Glatt, Glatt GmbH, Germany), so that a 50 % drug loading weight gain was reached. The overall final drug load including the functional layer is 21 % w/w. The composition of the layering suspension is given in Table 1.
| Material | QTY |
| Starter pellet: Cellets® 100 | 100 g |
| API: Gliclazide | 10 % w/w |
| Aqueous vehicle for API: | |
| Hypromellose | 1 % w/w |
| Talc | 1.9 % w/w |
| Coating of API layered pellets: | |
| Water | |
| Eudragit® NM 30 D | |
| Talc | |
| Functional coating: | |
| Magnesium stearate | |
| Silicon dioxide | |
Table 1: Formulation for Gliclazide layered starter pellets: starter pellets, aqueous API layering, release profile coating, functional coating.
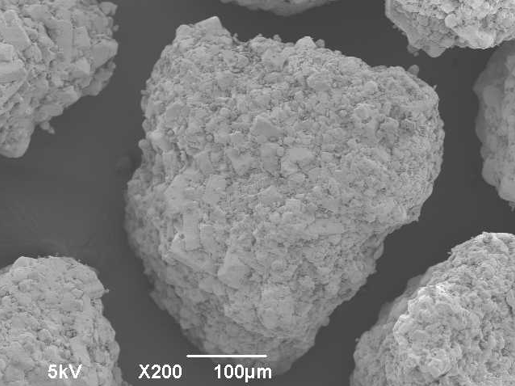
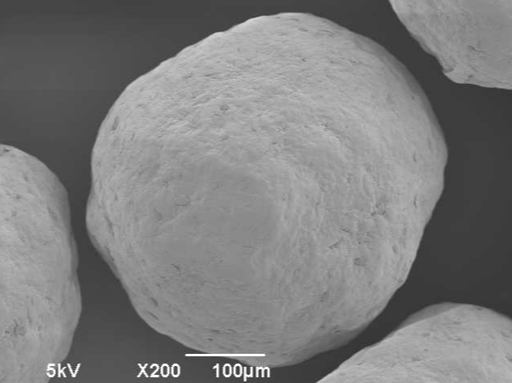
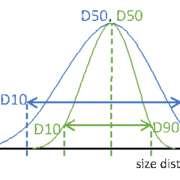
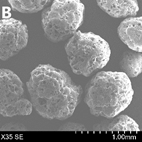
Although the formulation contains several coating and layering processes, the processed micropellets stay smooth in surface, show a high sphericity and narrow size distribution.
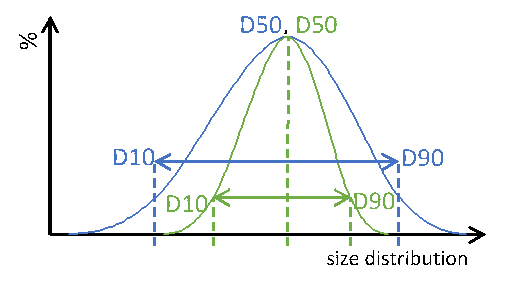
Size distribution and dissolution profiles of Gliclazide microparticles
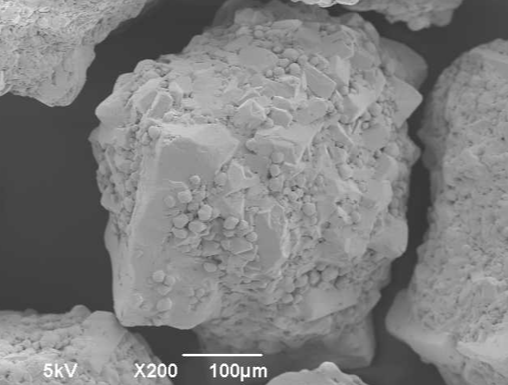
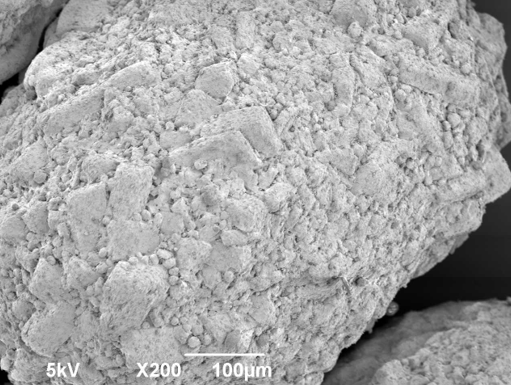
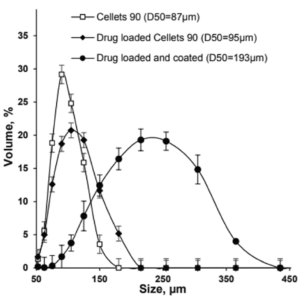
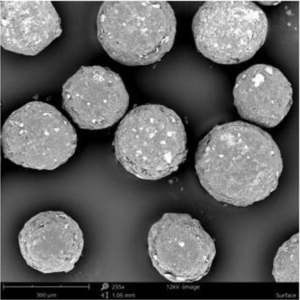
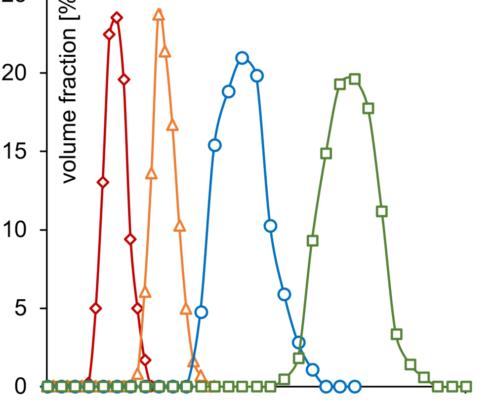
Polymer coated micropellets with CL25 (coating level 25 %) are shown in Figure 2. The yield of polymer coating and the final D50 values of the micropellets are displayed in Table 2.
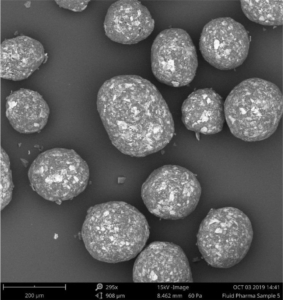
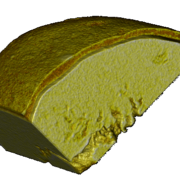
Figure 2: SEM image of layered Gliclazide sustained release micropellets with a weight gain at 25 % (CL25).
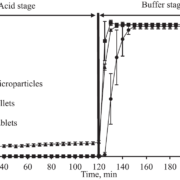
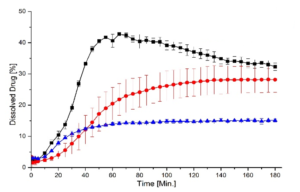
Depending on the polymer coating, micropellets show a different Gliclazide release profile as shown in Figure 3: With increasing weight gain, the dynamics of Gliclazide release are slowed down. A comparison to Diamicron SR tablets in a pH 7.4 phosphate buffer, the CL25 formulation results in an adequate release profile.
| Micropellet | Size D50 [µm] | Yield [%] |
| Starter pellet (Cellets® 100) | 160 ± 2.1 | |
| Micropellet at CL16 | 173 ± 3.6 | 98.4 |
| Micropellet at CL20 | 185 ± 2.4 | 99.3 |
| Micropellet at CL25 | 198 ± 4.3 | 99.0 |
| Micropellet at CL60 | 208 ± 6.7 | 98.7 |
Table 2: Particle size of the micropellets with and without layering. CL = coating level / weight gain in [%]. The yield for the polymer coatings at respective weight gains.
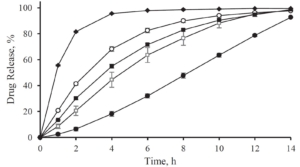
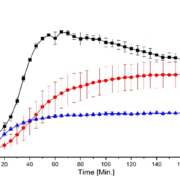
Figure 3: Gliclazide release from layered micropellets at coating levels 16 % (filled diamond), 20 % (open circles), 25 % (filled squares) and 60 % (filled circles) and the commercial Diamicron SR tablets (open squares) in phosphate buffer pH 7.4.
Incorporation of the Gliclazide microparticles into jellies
The incorporation of sustained release Gliclazide microparticles into the Jellies is realized through mixing the required quantity of microparticles with polymers (sodium alginate or polymer mixture).
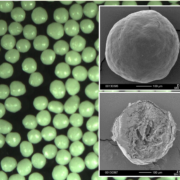
Sodium alginate is known to form gels in the presence of calcium ions at room temperature. Depending on the formulation, granular jellies (soft and easy to flow) or free-standing jellies (“ready-to-eat”) are formed. Formulations of jellies with and without API layered micropellets are shown in Figure 4. Incorporating the micropellets into the jellies did not cause a visual change in color or appearance. The API was kept inside the jellies. Also physical-chemical properties such as the gel strength, the texture, and the oral transit time in an in-vitro swallowing simulator are remained unchanged.
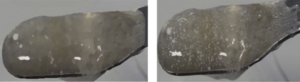
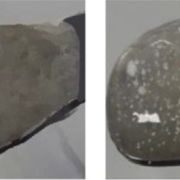
Figure 4: Images of a Jelly without (left) and with incorporation of sustained release micropellets (right).
Figure 4: Images of a Jelly without (left) and with incorporation of sustained release micropellets (right).
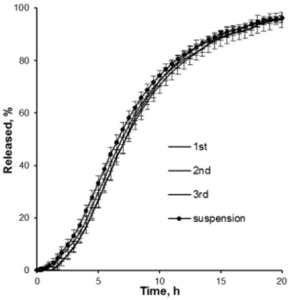
A release profile of Gliclazide with a coating level of 25 % in a jelly formation is shown in Figure 5. In comparison to a reference release profile of a Diamicron 30 mg SR tablet, the coated micropellets show a competitive behavior as already discussed in Figure 3. After incorporating into the jelly formation, the release profile is decaying. Obviously, the intact and also the fragmented jelly formulation show comparable dynamics. In order to obtain a comparable release profile than with the non-formulated micropellets, a coating level of down to 20 % is required.
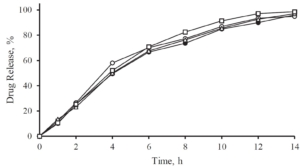
Figure 5: Gliclazide release from coated microparticles and in combination with Jellies in a pH 7.4 phosphate buffer. Diamicron 30 mg SR tablet (open triangle), no jelly at CL25 (closed triangle), jelly formulation (intact) incorporated with CL25 (closed circle), jelly formulation (fragmented) incorporated with CL25 (open circle), jelly formulation (intact) with CL20 (open square).
Summary
Sustained release Gliclazide micropellets with a final particle size D50 of less than 200 µm are successfully formulated with a 99 % production yield and adjustable drug release profiles.
The micropellets are based on Cellets® 100 and present an excellent surface smoothness, high sphericity and narrow size distribution. They were successfully incorporated in jelly formulations. This novel drug delivery platform is a suitable vehicle for the administration of sustained release microparticles. It is a valuable attempt to replace the commonly used thickened fluids for dysphagia patients.
Acknowledgement
Dr. Fang Liu and her team are gratefully acknowledged for serving content for this note.
![]()
Fluid Pharma Ltd
Contact: Dr. Fang LIU
College Lane, Hatfield, AL10 9AB, UK
Tel: +44 1707 28 4273
+44 796 3230 628
References
[1] S. Patel et al., Journal of Pharmaceutical 109 (2020) 2474-2484.

 Ingredientpharm
 glatt.com
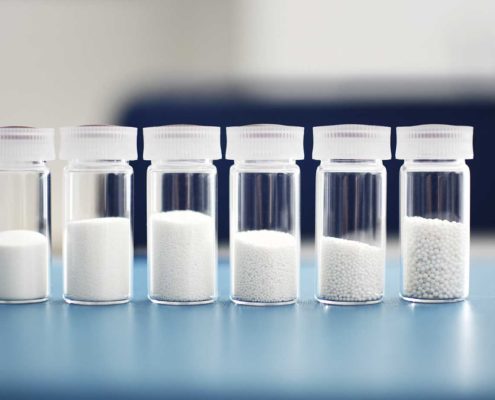
 ingredientpharm