CELLETS® Technical Resources

CELLETS® are pellets or spheres made of microcrystalline cellulose. The size ranges from 100 µm to 1400 µm. Being neutral starter cores, they can be used as carrier system for low-dosed APIs and allow diverse functional coating. See pellet technologies for a detailed description.

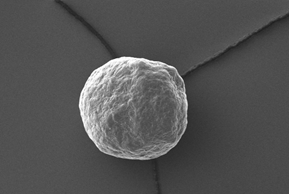
CS_sphericity_image_4

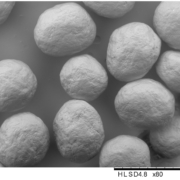
Electron microscopy yield perfect imaging data of the MCC pellets’ surfaces. Magnification: 250x, working distance 8.0 mm, voltage: 10 keV.

Available size classes are (click for more information):

Any size class of CELLETS® have same striking advantages:

  • low friability and extreme hardness
  • insolubility in water
  • high spherictity
  • smooth surface
  • good monodispersity

See case studies to see these starter pellets in action!

The patent application US20240139215A1 focuses on the development of controlled release formulations for highly lipophilic physiologically active substances, such as cannabinoids. These substances tend to have high lipid solubility (log P of 4 or more), making them difficult to deliver in a controlled and effective manner. This patent addresses the need for efficient controlled release systems that can provide consistent therapeutic effects by utilizing a matrix-based approach.

The formulation includes a matrix that contains one or more highly lipophilic active substances and water-soluble binders like hydroxypropyl methyl cellulose (HPMC), methyl cellulose (MC), or similar polymers. The key challenge with such substances is their tendency to release slowly and incompletely when taken orally, which this patent solves by adjusting the proportion of water-soluble binders. The binder content is carefully selected to be between 0.1-10% of the total matrix weight, optimizing the release rate of the active substances over the gastrointestinal transit time.

One of the innovative aspects of the invention is the use of matrix pellets, which are small particles with a size range of 30 µm to 1800 µm. These pellets may be administered in various forms, such as capsules, tablets, or sachets. The flexibility of the dosage forms makes it easier to control and adjust the release kinetics of the active ingredients.

The CELLETS® play a crucial role in this formulation. They are used as neutral cores for the deposition of the active substances and their binders. CELLETS® are microcrystalline cellulose spheres that provide an ideal substrate for layering the active substance and polymers, ensuring uniform distribution and controlled release. By using these CELLETS®, the formulation can achieve a more predictable and consistent release profile, crucial for substances like cannabinoids that require precise dosing to avoid psychoactive side effects while maintaining therapeutic efficacy.

Additionally, these pellets can be coated with other materials to further control the release rate if desired, though this is optional. In many embodiments, the matrix pellets themselves are sufficient to achieve the desired controlled release without the need for additional coatings.

In conclusion, the US20240139215A1 patent introduces a novel approach to the controlled release of highly lipophilic substances, leveraging matrix technology with carefully chosen water-soluble binders and neutral cores like CELLETS®. This method ensures effective delivery and consistent release, addressing the challenges posed by the lipophilic nature of substances like cannabinoids. In this specific patent, the following MCC Sphere types are recommended: CELLETS® 500.

Document information

Document Type and Number: (“Controlled release formulations of highly lipophilic physiologically active substances”)
Kind Code: A1

Inventors:

Mirko Nowak
Jay Jesko Nowak
Annette Grave
Monika Wentzlaff
Sarah Barthold
Christian Geugelin

Disclaimer

This text was generated by chatGPT engine version GPT‑4o, on Oct 21, 2024. Image was generated with Adobe Firefly.

The United States Patent Application US20240024263 focuses on methods of administering gamma-hydroxybutyrate (GHB) in combination with divalproex sodium (DVP), particularly for treating conditions like narcolepsy. The aim is to co-administer these drugs without altering their dosage or efficacy. The patent emphasizes how DVP affects GHB’s pharmacokinetics, allowing adjustments to minimize side effects while ensuring therapeutic benefits.

The role of CELLETS® in this patent is critical. CELLETS® are microcrystalline cellulose spheres used in drug formulations. They provide a stable, controlled-release matrix for GHB, ensuring consistent drug delivery over time. This controlled release minimizes fluctuations in drug concentrations, improving safety and efficacy. These MCC starter beads also help prevent interaction between GHB and DVP, ensuring that neither drug’s therapeutic effects are compromised.

By using CELLETS®, the formulation enhances the pharmacokinetic profile of GHB, ensuring a smoother and more predictable drug release. This innovation is crucial when GHB is administered alongside DVP, as it allows for better management of conditions like excessive daytime sleepiness or cataplexy, without significantly altering either drug’s profile.

In summary, this patent introduces an optimized co-administration strategy for GHB and DVP, with Cellets playing a pivotal role in achieving steady, controlled drug release and mitigating adverse drug interactions. This approach aims to improve the overall effectiveness and safety of treatment for sleep-related disorders. In this specific patent, the following MCC Sphere types are recommended: CELLETS® 90, CELLETS® 100 or CELLETS® 127. United States Patent Application US20240024263 seems as well to be a patent following the patent US11896572B2 wherein modified-release formulations are described.

Document information

Document Type and Number: (“Methods of administering gamma-hydroxybutyrate compositions with divalproex sodium”)
Kind Code: A1

Inventors:

Baek, Bong-Sook, Flamel Ireland Limited (Dublin, IE)

Disclaimer

This text was generated by chatGPT engine version GPT‑4o, on Oct 21, 2024. Image was generated with Adobe Firefly.

The development of modified release gamma-hydroxybutyrate represents a major advancement in narcolepsy therapy, aiming to improve both patient compliance and treatment effectiveness. Traditional formulations of gamma-hydroxybutyrate (GHB) require multiple nightly doses, which can disrupt sleep and reduce overall quality of life. The patented formulation described in US11896572B2 introduces a novel modified release system that extends the duration of action, making it possible to achieve 6 to 8 hours of therapeutic benefit with a single bedtime dose.

How Modified Release Gamma-Hydroxybutyrate Works

This formulation combines immediate-release and delayed-release mechanisms to provide both rapid onset and sustained therapeutic effects. The immediate-release portion allows GHB to take effect quickly, while the delayed-release portion maintains drug levels over time, reducing abrupt concentration peaks and minimizing side effects. This dual-action delivery is designed to improve pharmacokinetics and ensure more consistent symptom control.

The Role of CELLETS® in Modified Release Gamma-Hydroxybutyrate Drug Release

A central innovation in this patent involves the use of CELLETS®, spherical microcrystalline cellulose particles that provide a stable foundation for modified release drug delivery. In the immediate-release portion, CELLETS® carry a coating of sodium oxybate combined with a binder such as povidone. Meanwhile, the delayed-release portion relies on specialized polymers and hydrogenated vegetable oil, which work together to control pH-dependent release in the gastrointestinal tract. Furthermore, CELLETS® maintain consistent particle size and predictable dissolution rates, which in turn improve absorption and strengthen the overall pharmacokinetic profile of modified release gamma-hydroxybutyrate.

The CELLETS® play a crucial role in maintaining particle size consistency, which is important for ensuring predictable dissolution and absorption rates, thereby enhancing the overall pharmacokinetic profile of the drug. This innovation represents an advancement over traditional formulations by offering more reliable and patient-friendly narcolepsy management. This specific patent, recommend the following MCC Sphere types: CELLETS® 90, CELLETS® 100 or CELLETS® 127.

Advantages for Narcolepsy Patients

The patented system combines immediate and delayed release. This design allows for a once-nightly dose, which improves adherence and convenience for patients. The innovation also ensures more restorative sleep. At the same time, it reduces the burden of frequent dosing. As a result, narcolepsy management becomes more reliable and patient-friendly.

By refining the pharmacokinetics of GHB, modified release gamma-hydroxybutyrate offers a significant improvement over traditional formulations.

Document information

Document Type and Number: (“modified release gamma-hydroxybutyrate formulations having improved pharmacokinetics”)
Kind Code: B2

Inventors:

Jordan Dubow
Hervé Guillard
Claire Mégret
Jean-François DUBUISSON

Disclaimer

This text was generated by chatGPT engine version GPT‑4o, on Oct 21, 2024. Image was generated with Adobe Firefly.

Extended release compositions comprising pyridostigmine

The following patent on “Extended release compositions comprising pyridostigmine” employs CELLETS® as starter spheres made of Microcrystalline Cellulose. Please, read below a summary.

US Patent 20240299305 addresses an extended-release formulation of pyridostigmine, a drug primarily used to treat myasthenia gravis (MG). The goal of the patent is to create a dosage form that prolongs the drug’s therapeutic effects while minimizing side effects like dose dumping (a rapid release of the drug that can cause adverse effects). The patent describes a gastroretentive drug delivery system, designed to float and remain in the stomach for a longer time, thereby ensuring gradual release and absorption.

A key aspect of this patent is the use of CELLETS®, which are small, inert core particles used as carriers in pharmaceutical formulations. These CELLETS® serve as a starter sphere for the extended-release composition, being coated with layers of active ingredients like pyridostigmine and other substances that control the drug’s release rate. The formulation is intended to provide a controlled, steady release of pyridostigmine, improving patient outcomes by maintaining a stable plasma concentration of the drug for up to 24 hours.

The dosage form also incorporates components like a gas-generating agent, which enables the tablet to float in the stomach, and a water-soluble hydrophilic polymer that swells upon contact with gastric fluids, preventing the tablet from passing through the digestive system too quickly. This gastroretentive property is vital to ensure that the drug stays in the stomach long enough to achieve the desired extended release.

By utilizing CELLETS® and other advanced components, the patent aims to reduce the frequency of administration (allowing for once-daily dosing) and improve patient compliance, which is especially important for MG patients who need consistent, long-term management of their symptoms.

Document information

Document Type and Number:  (“Extended release compositions comprising pyridostigmine”)
Kind Code: A1

Inventors:

Vaka, Siva Ram Kiran (Piscataway, NJ, US)
Desai, Dipen (Basking Ridge, NJ, US)
Phuapradit, Wantanee (Lewes, DE, US)
Shah, Navnit H. (Monmouth Junction, NJ, US)
Shelke, Namdev B. (Hillsborough, NJ, US)

Disclaimer

This text was generated by chatGPT engine version GPT‑4o, on Oct 18, 2024. Image was generated with Adobe Firefly.

Extended-release compositions comprising atomoxetine

The following patent on “Extended-release compositions comprising atomoxetine” employs CELLETS® as starter spheres made of Microcrystalline Cellulose. Please, read below a summary.

United States Patent Application 20240299307 focuses on an extended-release formulation of atomoxetine, commonly used for treating ADHD. The patent describes a unique pellet-based drug delivery system designed to control the release of atomoxetine over an extended period. This system aims to reduce the dosing frequency and maintain steady drug levels in the bloodstream, enhancing patient compliance and reducing the side effects associated with fluctuating drug levels.

Key Elements of the Invention:

  1. Pellets: The invention uses pellets as the core of the formulation, each containing atomoxetine or a pharmaceutically acceptable salt like atomoxetine hydrochloride. The pellets are coated with a functional layer that controls the rate and duration of drug release.
  2. Extended Release: The functional coating consists primarily of cellulose acetate-based polymers like cellulose acetate phthalate or cellulose acetate butyrate. This coating slows the drug’s release, allowing for less than 40% of the atomoxetine to be released within the first two hours, ensuring a sustained release for 8 to 20 hours, depending on the coating thickness.
  3. Patient Benefits: The extended-release design minimizes the need for multiple daily doses, improving patient adherence to the treatment. Additionally, it helps maintain consistent therapeutic levels of atomoxetine in the bloodstream, reducing the side effects from rapid peaks and valleys in drug concentration.
  4. Manufacturing Process: The pellets are made by applying a drug layer over a nonpareil seed (such as CELLETS®), followed by an optional sealing layer and a functional coating that dictates the extended-release profile. These pellets can be encapsulated or compressed into tablets.

Function of CELLETS®:

CELLETS® are microcrystalline cellulose spheres commonly used as a core in pellet-based formulations. In this patent, CELLETS® act as inert carriers that provide a solid foundation for the application of atomoxetine and subsequent coatings. Their uniform size and shape ensure consistent layering of the drug and functional coatings, which is crucial for achieving the desired release profile. CELLETS® facilitate the manufacturing of multi-particulate systems where each pellet provides a controlled dose of the active ingredient. By using CELLETS®, the formulation can be tailored for extended-release by controlling the thickness of the drug and polymer layers applied to the surface​.

In summary, this patent provides an effective method to enhance the therapeutic benefits of atomoxetine, focusing on an extended-release formulation that improves patient outcomes through consistent drug release and convenient dosing.

Document information

Document Type and Number:
Kind Code: A1

Inventors:

Tu, Yu-hsing (West Windsor, NJ, US)
Chalamuri, Shanmuka Harish (Plainsboro, NJ, US)
Kathala, Kalyan (Monroe, NJ, US)
Perumal, Ashok (Monmouth Junction, NJ, US)
Lee, James A. (West Windsor, NJ, US)

Disclaimer

This text was generated by chatGPT engine version GPT‑4o, on Oct 18, 2024. Image was generated with Adobe Firefly.

Influence of Polymer Film Thickness on Drug Release from Fluidized Bed Coated Pellets

This article “Influence of Polymer Film Thickness on Drug Release from Fluidized Bed Coated Pellets and Intended Process and Product Control” was published on Pharmaceutics 2024, 16(10), 1307; https://doi.org/10.3390/pharmaceutics16101307, under free licence on October 08, 2024 by Marcel Langner, Florian Priese, and Bertram Wolf. We performed modifications of the text for better readability.

Abstract

Background/Objectives: Coated drug pellets are widely used in hard gelatine capsules. In heterogeneous pellets, the drug is layered onto core pellets. Coatings often provide retarded release or enteric protection.

Methods: In this study, we correlated polymer coating thickness on drug pellets with drug release kinetics.

Results: We investigated whether the coating process can be stopped once the desired layer thickness is achieved. First, inert pellets were coated with sodium benzoate. Then, they received different amounts of water-insoluble polyacrylate in a fluidized bed apparatus with a Wurster inlet. We controlled the entire process in-line and at-line using process analytical technology. This involved measuring particle size and layer thickness. Next, we examined in-vitro sodium benzoate release. We linearized the data with various standard models and compared it with polyacrylate layer thickness. As polyacrylate layer thickness increased, the release rate decreased. Several factors influenced release simultaneously, resulting in profiles that approximated first-order kinetics. Thus, the coating thickness corresponded to a specific drug release profile.

Conclusions: Manufacturing coated drug pellets with a targeted release is achievable through process control and layer thickness measurement. However, preliminary investigations are needed for each formulation.

1. Introduction

The dissolution of solid drug formulations depends on the solubility and dissolution rate of the drug substances. In addition, several factors influence release kinetics. For example, drug interaction with excipients, compression force and hardness in tablets, and the type of binder in granulates, pellets, or polymer coatings all play a role.

Understanding the dissolution rate and release kinetics is essential for optimal pharmacotherapy. Dissolution of solid substances typically follows first-order kinetics due to diffusion processes. However, some formulations show zero-order release, where equal amounts are released in equal time intervals.

Multiple processes often occur simultaneously. These include wetting of the dosage form, drug dissolution, diffusion of drug molecules out of the dosage form, swelling of matrix formulations, and water uptake by insoluble films. As a result, the kinetics may not fit simple zero-, first-, square-, or cubic-root order equations.

To evaluate the best approach, release data are linearized using various models. The coefficient of determination (CoD) of the linearized curve indicates the best fit and suggests which process likely dominates [1,2,3,4,5,6].

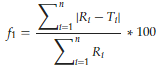
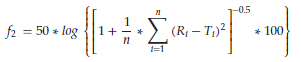
The model-independent parameters, difference factor f1 and similarity factor f2, are used to compare release profiles. f1 describes the relative error between two release profiles. It is calculated from the cumulative amounts released at a specific time T for a test and a reference formulation, or more generally, between any two formulations—for example, during drug development. On the other hand, f2 is based on the sum of squared deviations of the released drug amounts from the two profiles [4,5,7,8,9].

Focuses on drug-loaded pellets and their controlled release

Increasing attention has therefore focused on drug-loaded pellets and their controlled release. Specifically, this control is achieved by slowly swelling matrix systems or, alternatively, a final functional coating. Consequently, researchers have investigated the release of drugs from matrix pellets prepared by extrusion/spheronization and, moreover, coated with different amounts and types of insoluble ethylcellulose [10,11,12].

In addition, other studies report additional factors influencing drug release. For example, these include the filler type [13], the pH of the release fluid [4], storage conditions of the drug and methylcellulose matrix pellets [14], the amount of enteric polymer coating [15], and, finally, the salt concentration in the release fluid [16].

Further investigations examine the effects of talc and hydrogenated castor oil on the dissolution of metformin-loaded matrix pellets with an acrylic-based sustained-release coating [17]. Researchers also studied the sustained release of Lisinopril from mucoadhesive matrix pellets [18] and sinomenine hydrochloride from pellets produced using a novel whirlwind fluidized bed process [19].

Drug-layered inert pellets coated with polymer (heterogeneous pellets) were studied in order to assess the influence of release kinetics. Specifically, researchers investigated modifications of ethylcellulose coatings [20]; furthermore, they studied ethylcellulose mixed with polyvinylpyrrolidone (PVP) as a pore former [21], alternating layers of ethylcellulose and polyvinylacetate [22], various coating levels with final curing [23], and additionally, acetaminophen-layered sugar pellets coated with ethylcellulose [24]. Moreover, with polyacrylate coatings, drug release from layered pellets was delayed [7,25]. Therefore, changing the polymer type and layer thickness allowed control of the release rate over a wide range [8].

heterogeneous pellets coated with sodium benzoate

In our previous studies, heterogeneous pellets were manufactured using fluidized bed technology with a Wurster inlet. Initially, inert microcrystalline cellulose pellets (Cellets®175, median 170 µm), which offer a large specific surface area, were first coated with excipients as well as the water-soluble model drug sodium benzoate [26,27,28]. Consequently, these sodium benzoate (SB) pellets showed narrow particle size distribution, high sphericity, homogeneous layers, and additionally, rapid drug release. Subsequently, to achieve retarded release, the SB pellets were coated a second time with different amounts of ethylcellulose using the same fluidized bed technique [29]. As expected, the release rate decreased with increasing coating thickness. Moreover, the process was monitored in-line using spatial filter velocimetry (SFV) probes [27,28] to ensure control over particle size, distribution, and ethylcellulose layer thickness.

The present project aimed to produce heterogeneous pellets in a fluidized bed with a Wurster inlet while controlling the process using in-line particle size and coating thickness measurements. We studied sodium benzoate release kinetics, interpreted the partial processes affecting release, correlated release rate with polymer thickness, and determined the coating process endpoint to improve pellet quality.

PVP binder to improve layer stability

For pellet manufacturing, we followed a similar experimental approach to [26,27,28]. Small initial inert pellets (Cellets®175, median 170 µm) with large specific surface areas were coated with a sodium benzoate solution containing a small amount of PVP binder to improve layer stability. In the second step [29], SB pellets received varying amounts of insoluble but slowly swelling polyacrylate for retarded release. Agglomeration risk during coating was minimized by adjusting process parameters and adding talcum as an anti-stick agent. The SFV probe monitored particle size and detected agglomerates in real time.

Drug release was analyzed using zero-order, first-order, square-root, and cubic-root kinetic models. We identified the most likely release model by calculating area under the curve (AUC), dissolution efficiency (DE), and mean dissolution time (MDT), and by comparing the CoD of different models. We also calculated the difference factor f1 and similarity factor f2 to compare release profiles of different polyacrylate-layered pellet batches. Linearization works well for first-order kinetics. For other release profiles, nonlinear methods describe dissolution curves more accurately and reduce standard deviation in fitting parameters [30].

2. Materials and Methods

2.1. Materials

Pellets of microcrystalline cellulose (Cellets® 175, particle size range 150–200 µm, median 170 µm, IPC Dresden,, Germany), together with sodium benzoate (Applichem, Darmstadt, Germany, solubility 57 g in 100 g water at room temperature), PVP (Kollidon®25, Carl Roth, Karlsruhe, Germany), talcum (Talkum Pharma, C. H. Erbslöh, Krefeld, Germany), magnesium stearate (VEG Pharma, Rome, Italy), and additionally polyacrylate dispersion (Eudragit®NE 30D, Evonik Industries, Darmstadt, Germany, containing ethylacrylate-methylmethacrylate copolymer 30% w/w) were used. Importantly, all substances conform to European Pharmacopoeia (Ph.Eur.) quality [31].

2.2. Formulation of Sodium Benzoate-Coated Pellets

Microcrystalline cellulose pellets were coated with an aqueous solution of sodium benzoate 30% (w/w), PVP 1.5% (w/w) and talcum 0.5% (w/w) in a first coating step (Table 1). Sodium benzoate and PVP were dissolved one after another in purified water and finally talcum was suspended under agitation with a blade stirrer.
Table 1. Sodium benzoate pellet formulation.
Content (%)
Sodium benzoate 32.6
Microcrystalline cellulose 65.3
PVP 1.6
Talcum 0.5
100.0

2.3. Formulation of polyacrylate-coated sodium benzoate pellets

In the second coating step, SB pellets were layered with polyacrylate in three concentration lots: P1 (11.1% w/w PVP), P2 (14.3% w/w), and P3 (17.6% w/w). Magnesium stearate and talcum were added to the coating fluid. They acted as a plasticizer and an anti-stick agent, respectively (Table 2).

The polyacrylate coating fluid contained 13.3% (w/w) polyacrylate copolymer, 1.3% (w/w) magnesium stearate, and 5.3% (w/w) talcum. To prepare the mixture, we added a Eudragit®NE 30D dispersion to a beaker. Next, magnesium stearate and talcum were added one after another. The dispersion was homogenized under strong agitation with a disperser (Ultra Turrax T50 standard, Janke & Kunkel, IKA Labortechnik, Staufen, Germany; length 225 mm, diameter 18 mm, rotation 5000 rpm).

Table 2. Polyacrylate coated sodium benzoate pellet.
Lot P1 P2 P3
Content (%)
Sodium benzoate 25.9 24.4 22.9
Microcrystalline cellulose 55.7 52.6 49.3
PVP 1.3 1.2 1.1
Polyacrylate 11.1 14.3 17.6
Talcum 4.9 6.1 7.4
Magnesium stearate 1.1 1.4 1.7
100.0 100.0 100.0

2.4. Fluidized bed pellet coating

The coating process took place in a batch laboratory fluidized bed apparatus (GPCG 1.1, Glatt, Binzen, Germany). The system included a Wurster inlet and an SFV probe in the process chamber [27]. A spray nozzle of 1.0 mm diameter was used, with the nozzle cap set at 2.5 scales. The distance between the lower cylinder end and the perforated bottom plate B was fixed at 20 mm. The process air volume rate varied between 40 and 60 m³/h and was adapted to the increasing pellet weight during coating.

In the first step, Cellets®175 were coated with a sodium benzoate/PVP/talcum aqueous fluid (Table 3). In the second step, pellets received a polyacrylate dispersion under mild conditions. A lower spray rate and reduced process air temperature prevented pellet adhesion and sticking. Afterward, the polyacrylate-coated pellets were tempered for one hour at 30 °C. They were spread as a thin layer on a steel dish to allow coalescence and film formation.

Table 3. Process parameters of pellet fluidized bed coating with sodium benzoate (first step) and polyacrylate (second step).
Parameter First Step Second Step
sodium benzoate polyacrylate
pellet batch (g) 300
process air temperature (°C) 80 40
product temperature (°C) 40 25
process air volume rate (m3/h) 40–60
spray rate (g/min) 20 6
spray pressure (bar) 3

2.5. Particle Size Coating Layer Thickness Measurement with SFV Probe

The particle size and thickness of the coating layer were measured in-line by the SFV probe (IPP 70, Parsum, Chemnitz, Germany). The probe was directly installed into the down-bed zone of the process chamber. Details of probe measurement are described elsewhere [27,28].

2.6. Sodium Benzoate Release and Content Investigation

The release was tested using a dissolution tester (PTW 2, Pharmatest, Hainburg). Specifically, the setup included six vessels containing 1.0 L purified water maintained at 37 °C, with a blade rotation of 75 rpm. Then, sampling took place at 10, 20, 30, 45, 60, 120, and 180 minutes. After each withdrawal, the volume was refilled with fresh purified water. Subsequently, sodium benzoate was analyzed using a UV–Vis spectrophotometer (Spekol 1300, Analytik Jena, Germany) with a 1 cm quartz cuvette at 220 nm.

For sodium benzoate content analysis, 50 mg of pellets were dispersed in 1.0 L purified water. These pellets contained 13.5 mg sodium benzoate. Dissolution and release were complete after 4 hours. The content was then analyzed as described above.

2.7. Linearization of Release Curves

The evaluation of the release curves was performed according to the different models of release kinetics also used by a number of authors [1,3,5,6,9,14]. In the first step of the release evaluation, the amount of cumulative released substance is plotted versus time. Linear curves arise in the case of zero order kinetics, i.e., equal amounts of the drug are released in equal time intervals (Equation (1)).

Mt = −k0 ∗ t + M0

First-order release kinetics are typical for slightly soluble drugs in solid preparations such as tablets, pellets, and granules. These systems are dominated by slow dissolution and diffusion control. At the beginning of the process, the release rate is highest. This occurs because the large concentration gradient drives diffusion, as described in Fick’s first law (Equation 2). However, the release rate gradually decreases as the concentration gradient diminishes during the process.

1/A ∗ dn/dt = −D ∗ dc/dx

The released amount Mt at the moment t refers to (Equation (3)), and linearization results in the Sigma minus function (Equation (4)).

Mt = M0 ∗ (1 − exp(−k1∗t))
ln (M0 − Mt) = ln (M0) − k1 ∗ t

The Weibull function (Equation (5)) and its linearized form (Equation (6)) presuppose first order kinetics.

Mt = M0 ∗ (1− exp (−t b/a)
ln (−ln (1−Mt/M0)) = b ∗ ln (t) − ln (a)

Square root kinetics occurs at non-disintegrating solid matrix formulations (Equation (7)).

Mt = kq ∗ √ t

Cubic root kinetics are observed in the case of spherical multiparticulate formulations (linearized form, Equation (8)).

Mt⅓ = M0⅓ − kc ∗ t

2.8. Model Independent Parameters: Difference Factor f1 and Similarity Factor f2

The difference factor f1 describes the relative error between two release profiles. It is calculated from the cumulative released amounts Ri and Ti at distinct time points for reference and test formulations (Equation 9). In contrast, the similarity factor f2 is based on the sum of squared deviations of released drug amounts (Equation 10). It expresses the statistical similarity between two profiles.

The f2 value equals 100 for identical profiles and ranges between 50 and 100 for similar ones. Together, both factors serve to compare the release profiles of generic and standard drug products. This comparison helps determine whether the generic profile matches or surpasses the standard.

In this study, we applied both factors to evaluate differences and similarities in sodium benzoate release profiles with various polymer coatings.

Eq9

(9)

Eq10

(10)

2.9. Microscopically Investigation

Coated pellets were placed on black paper for an improved contrast. Size and shape were investigated with a stereo light microscope (Stemi 2000-C, Carl Zeiss, Oberkochen, Germany, ocular: W-PI, 10×/23, magnification: 5.0, 50 scale = 1 mm). Photographs were shot by mobile.

2.10. Sphericity

The sphericity of the pellet lots was measured by digital image processing (Camsizer®, Retsch, Haan, measuring particle size range 40–3000 µm, measured particles 20,000 per second). The chord length was used for the evaluation of particle size and particle size distribution.

2.11. SFV Measurement

The SFV probe was installed directly into the process chamber of the fluidized bed apparatus between the inner chamber wall and the Wurster inlet. Details are described elsewhere [27].

3. Results and Discussion

3.1. Properties of Sodium Benzoate and Polyacrylate Coated Pellets

SB pellets are received as a free-flowing material. The coating process proceeded smoothly, and the Wurster inlet created a homogeneous fluidized bed pattern. As a result, the product shows a narrow particle size distribution [27]. The median x50.3 increased from 170 µm (uncoated Cellets® 175) to 200 µm. The sphericity of both the initial Cellets®175 and SB pellets remained above 0.9.

The polyacrylate coating of SB pellets caused no significant agglomeration. Only a few twins and triplets appeared under microscopic observation (Figure 1). The median size of polyacrylate-coated pellets grew to 232.2 µm, with a layer thickness of 16.1 µm (Table 4, P3, 17.6% polyacrylate content). Yield losses and incomplete sodium benzoate recovery resulted from material precipitation at the textile filter and inner chamber wall. Nevertheless, a sphericity above 0.9 confirms the formation of spherical products and indicates homogeneous processing.

Figure 1. SEM photograph of a polyacrylate coated SB pellet.

Influence of Polymer Film Thickness on Drug Release from Fluidized Bed Coated Pellets

Table 4. Median, polyacylate layer thickness, product yield, sodium benzoate content and sphericity of polyacrylate coated SB pellets.
X50.3 (µm) Polyacrylate
Layer
Thickness (µm)
Yield (%) Sodium
Benzoate
Content (%)
Sphericity
(-)
P1 213.0 6.5 84 92 0.91
P2 221.0 10.5
P3 232.2 16.1

3.2. Sodium Benzoate Release Kinetics

3.2.1. Double Linear Diagram (Zero Order Release Kinetics)

After five minutes, more than 90% of sodium benzoate dissolves from SB pellets without a polymer layer. This is due to its high solubility and rapid dissolution rate. Sodium benzoate behaves as a strong electrolyte (sodium salt of benzoic acid, pKa 4.19 [31]), so it dissociates considerably into sodium cations and benzoate anions.

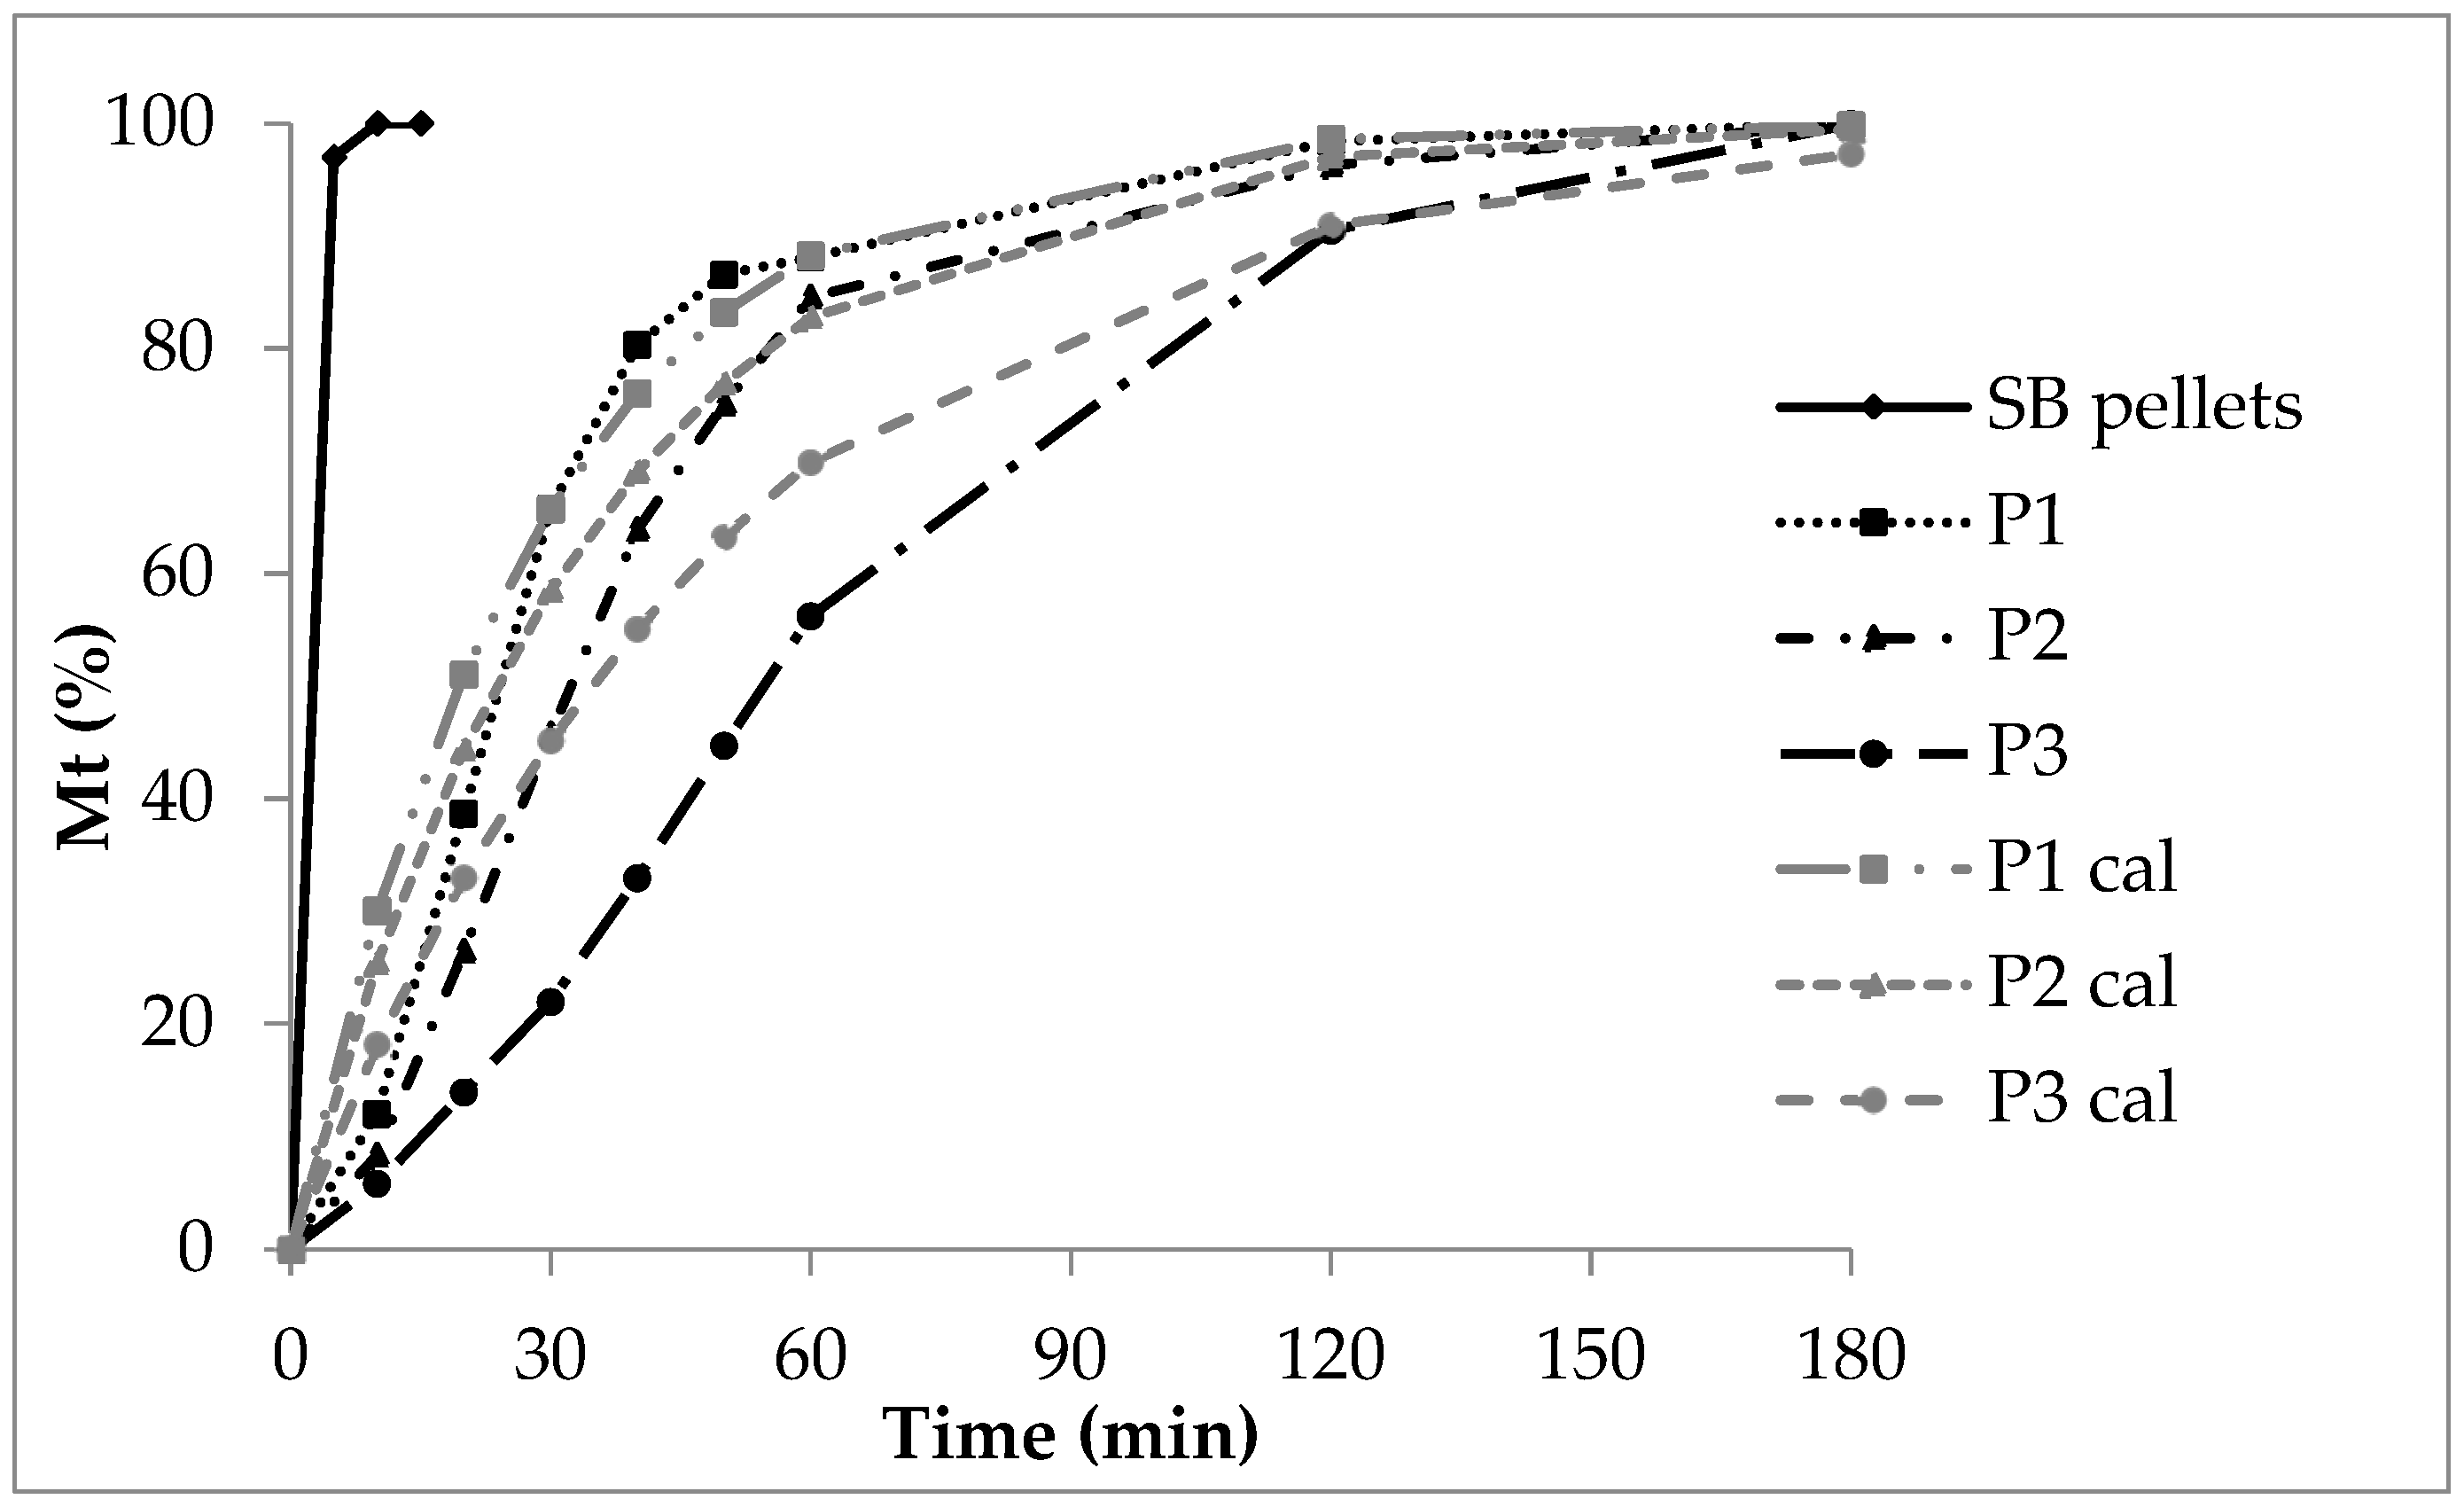
In contrast, the release from polyacrylate-coated pellets follows exponential curves (Figure 2). Generally, the release rate decreases as the polyacrylate layer thickens. The insoluble polyacrylate acts as a barrier. After ten minutes, 30% of sodium benzoate is released from low coating (P1), 20% from medium coating (P2), and 8% from high coating (P3).

diffusion of sodium benzoate molecules and ions

The dissolution rate of sodium benzoate alone cannot explain the release. Instead, diffusion of sodium benzoate molecules and ions through the polymer layer controls the rate. Initially, a high concentration gradient drives rapid release. Later, the release rate slows as the concentration gradient decreases.

For low coating (P1), the CoD of zero-order kinetics is 0.57 (Table 5), indicating zero-order release is unlikely. First-order diffusion seems to control the process. With increasing polyacrylate thickness, zero-order CoD rises (P2: 0.70, P3: 0.93). This reflects additional effects, such as polymer swelling and prolonged diffusion distance. Consequently, the release rate decreases as polyacrylate content rises, which is evident in decreasing AUC and DE, and increasing MDT (Table 6).

Figure 2. Double linear plot of the sodium benzoate release, SB pellets without polyacrylate layer, experimental release from polyacrylate-coated lots P1, P2 and P3 with increasing layer thickness and calculated release P1cal, P2cal and P3cal.

Influence of Polymer Film Thickness on Drug Release from Fluidized Bed Coated Pellets 002

Table 5. CoD of sodium benzoate release profiles, kinetic models of zero order, first order, square root and cubic root; lots P1, P2 and P3.
CoD (R2)
Model P1 P2 P3
Zero order 0.57 0.70 0.93
First order Sigma minus 0.98 0.98 0.95
First order Weibull 0.87 0.99 0.99
Square root 0.81 0.88 0.94
Cubic root 0.68 0.80 0.98
Table 6. Area under the curve, AUC, dissolution efficiency, DE, and mean dissolution time, MDT, of sodium benzoate release; lots P1, P2 and P3.
AUC (%∗min) DE (-) MDT (min)
P1 14,820 0.82 32
P2 13,927 0.77 41
P3 11,587 0.64 63

indicating equivalence between P1 and P2

The release profiles of lots P1 and P2 (Figure 2) differ only slightly. Therefore, the f1 value of 12 (Table 7) is below 15, indicating equivalence between P1 and P2. In contrast, the deviation between P1/P3 and P2/P3 is much more pronounced. This is due to the thicker polyacrylate coating layers, which lead to an f1 above 15. Consequently, these pairs are evaluated as “not equivalent” regarding the relative error between cumulative released amounts Ri and Ti at specific moments. Overall, increasing the coating layer thickness clearly changes the release profiles.
Table 7. Difference factor and similarity factor of sodium benzoate release profiles, comparison of lots P1, P2 and P3.
Parameter Evaluation P1/P2 P1/P3 P2/P3
Difference factor f1 “equivalent”
0–15
12 24 25
Similarity factor f2 “similar”
50–100
74 63 67

similarity factor f2 decreases with the increasing layer thickness

The similarity factor f2 decreases with the increasing layer thickness and diminished release rate, which is obvious comparing P1 with P2 (74) and P1 with P3 (63). Nevertheless, both f2s confirm the similarity of the release profiles.
Release curves (P1cal, P2cal and P3cal, Figure 2) were calculated according to first order kinetics (Equation (2)) and by use of the experimental release rate constants of P1, P2 and P3 (Table 5) from the Sigma minus plots (Figure 3).
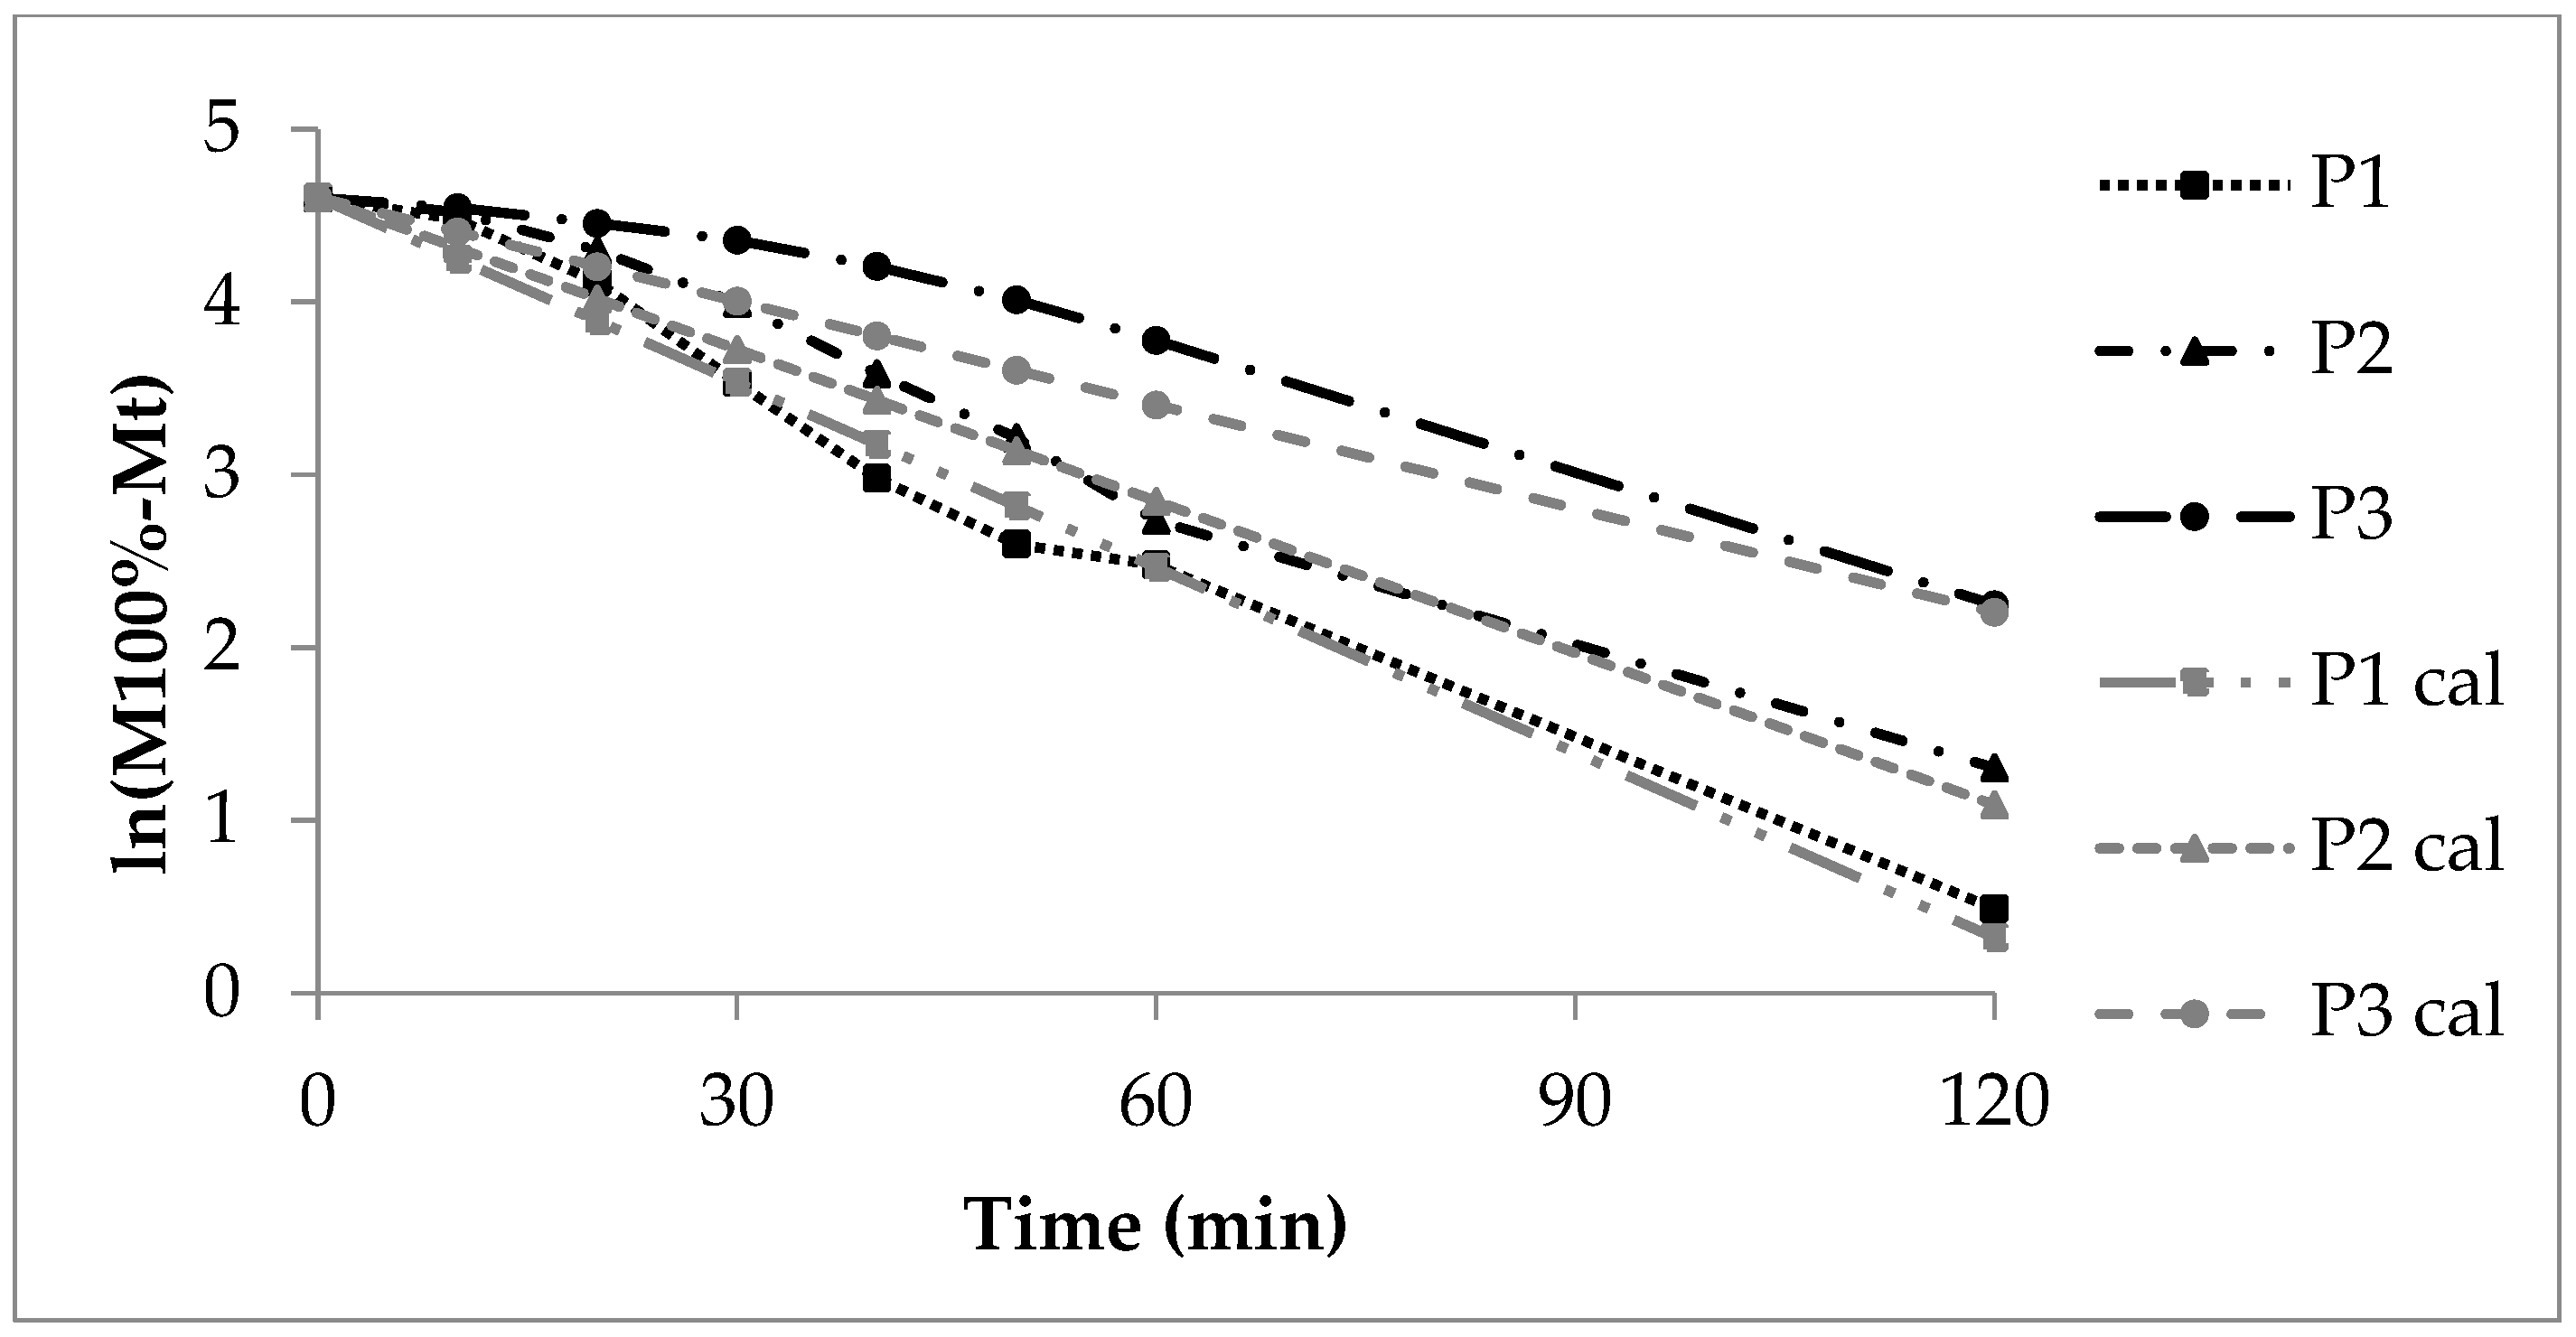
Figure 3. First order Sigma minus function of the experimental and calculated (cal) sodium benzoate release, lots P1, P2 and P3.
 Influence of Polymer Film Thickness on Drug Release from Fluidized Bed Coated Pellets 003

The calculated double linear curves (grey) roughly matched the experimental curves (black, Figure 2). However, the deviation was greatest for P3, which had the thickest polyacrylate layer. This was caused by several coinciding processes: slow film wetting and swelling, delayed water uptake, and limited diffusion through the polyacrylate film to the sodium benzoate layer. Next came sodium benzoate dissolution and its diffusion through the swollen polymer into the release fluid.

The high coating thickness played a critical role. It created a long diffusion path and continuously altered the sodium benzoate concentration gradient within the polyacrylate layer. Consequently, these factors strongly influenced the overall release rate.

3.2.2. First Order Kinetics, Sigma Minus Function

The Sigma minus function gives linear trends of the sodium benzoate release (Figure 3) according to first order kinetics and a CoD above 0.9 (Table 5). The release rate constant k1 decreases with growing polyacrylate coating (Table 8). The calculated curves P1cal and P2cal (Equation (3)) meet the experimental curves of P1 and P2, respectively (Figure 3). The diffusion of sodium benzoate through the polyacrylate layer and to some extent the polymer swelling are the rate controlling steps. The more pronounced deviation of the experimental from the calculated curve in case of P3 is explained by the reasons mentioned above.
Table 8. First order release parameters of the Sigma minus and Weibull function, lots P1, P2 and P3.
k1 (1/min) Sigma Minus b (-)
Weibull
1/a (-)
Weibull
t63.2% (min)
Weibull
P1 0.036 1.08 0.25 30
P2 0.030 1.58 0.17 40
P3 0.020 1.36 0.17 70

3.2.3. First Order Kinetics, Weibull Function

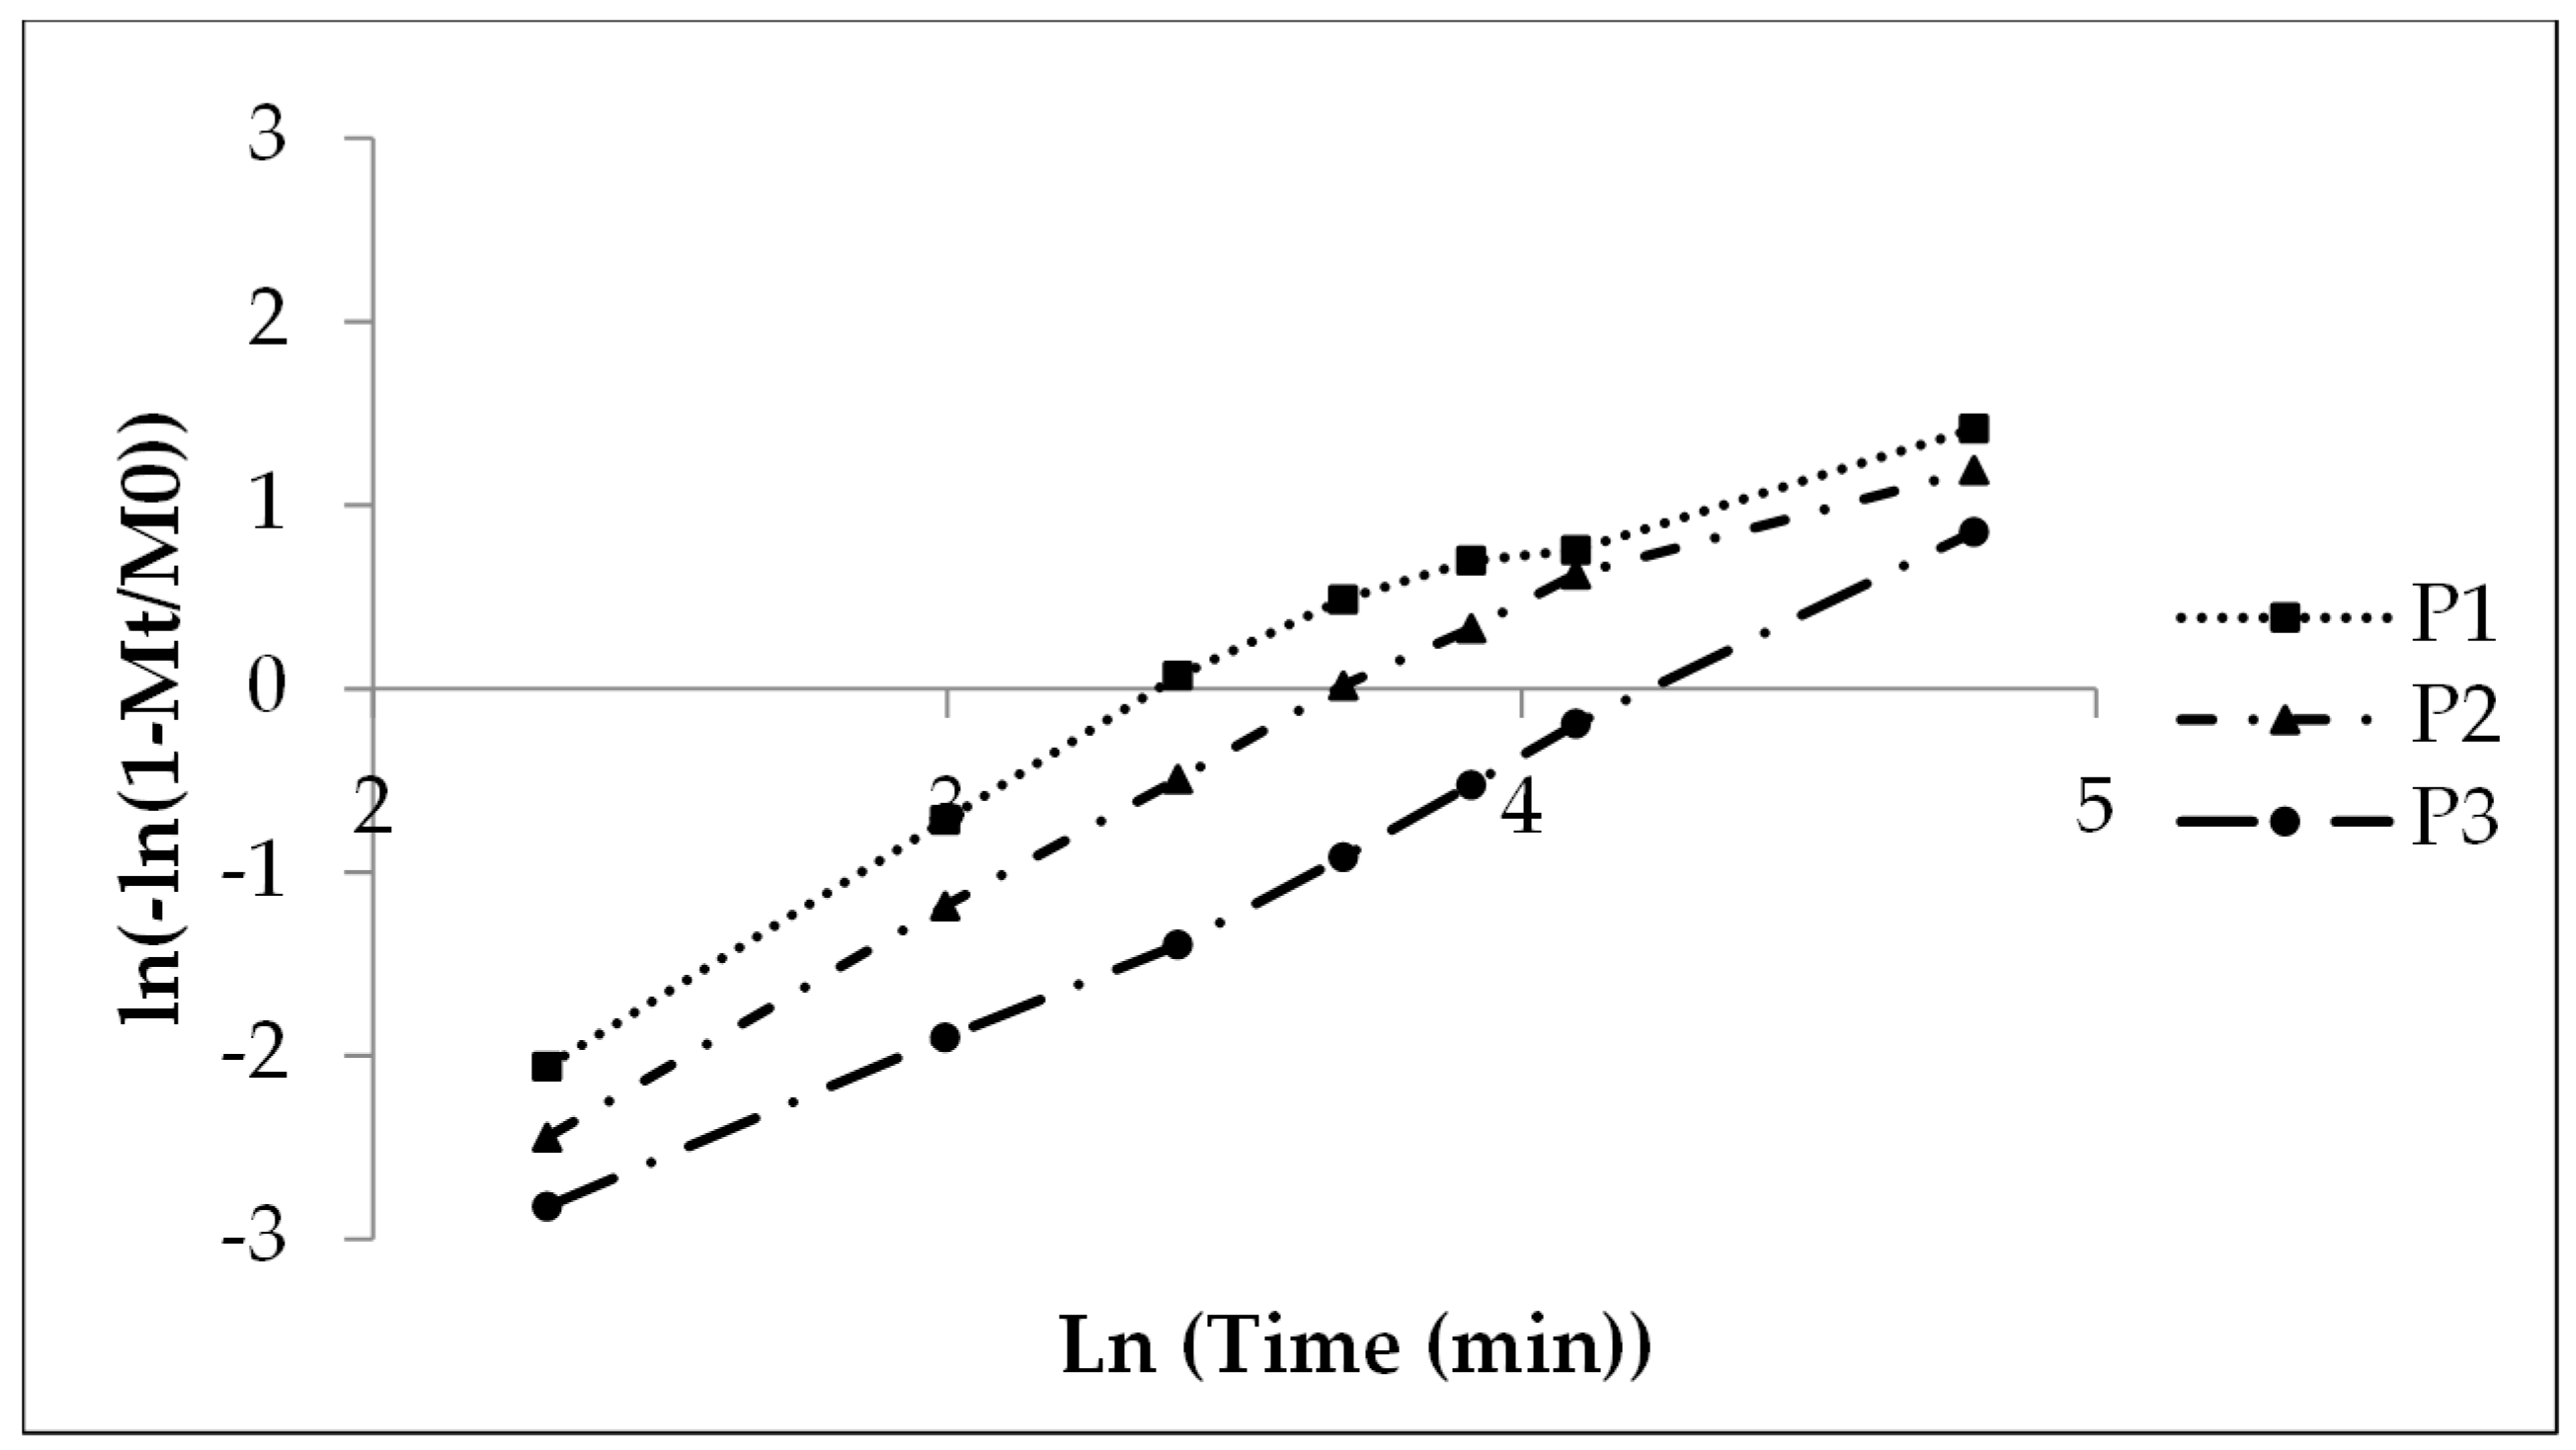
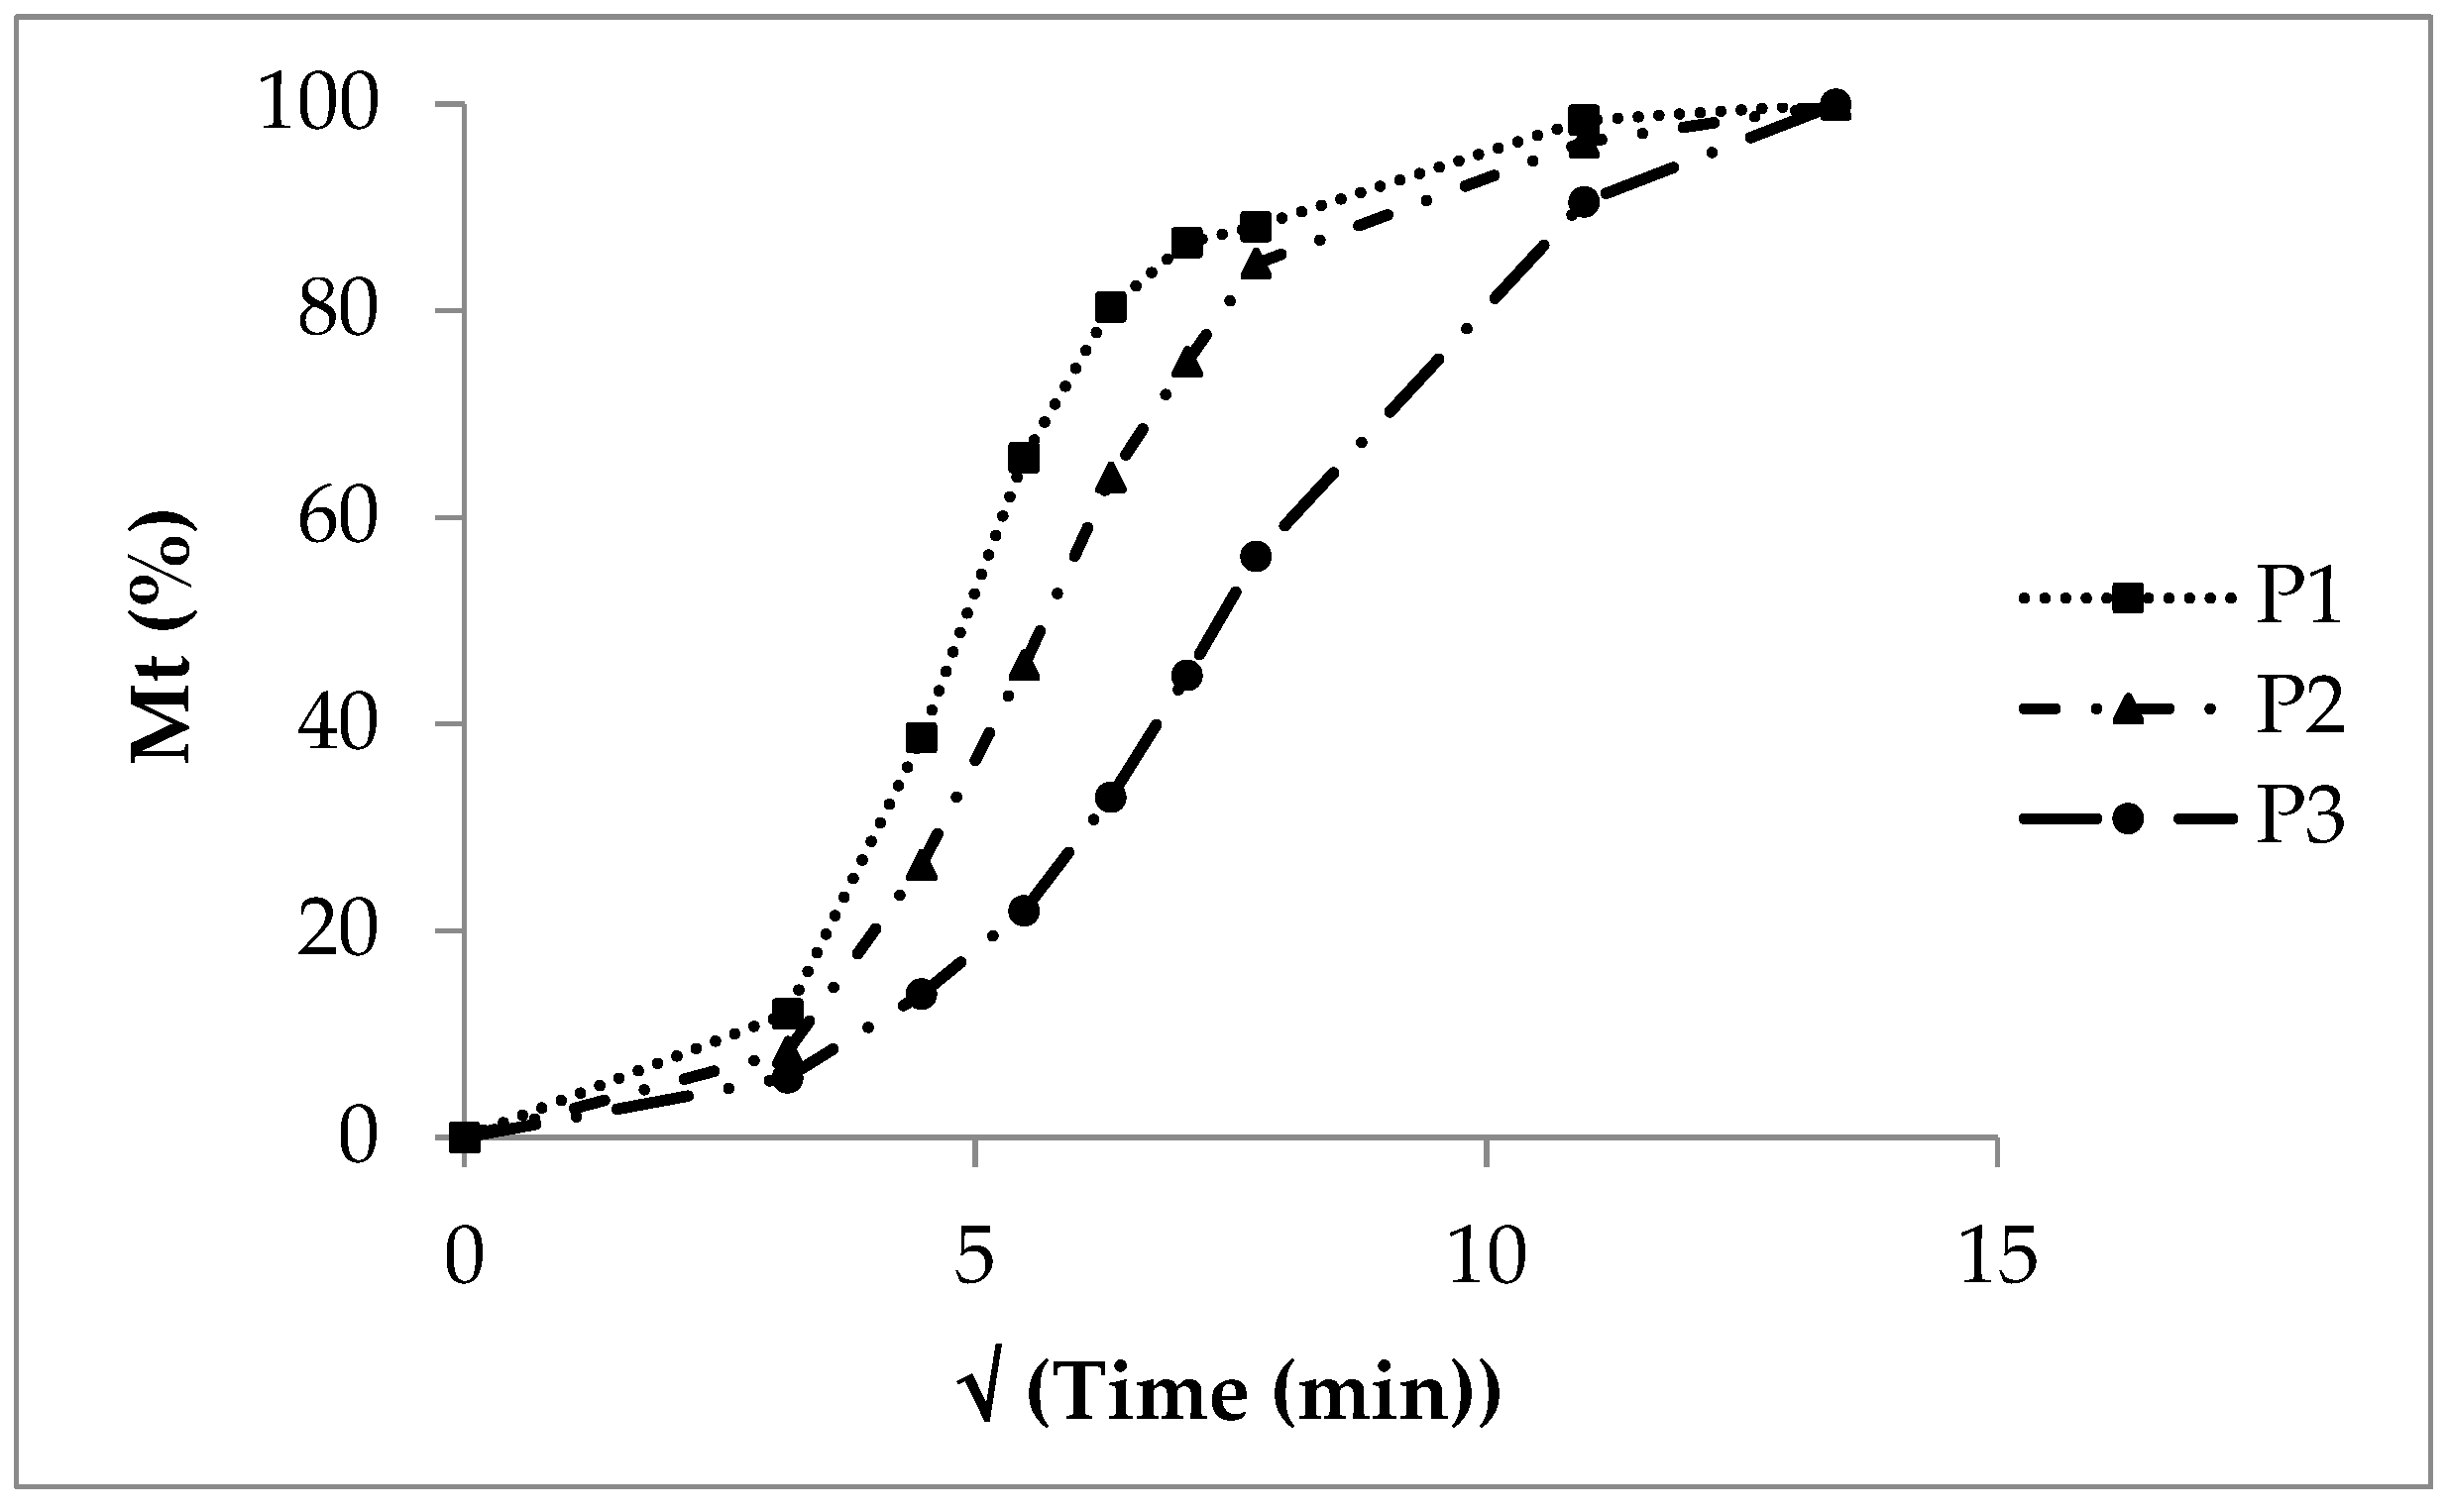
The Weibull function gives linear curves (Figure 4) comparable to the Sigma minus function (Figure 3) with coefficients of determination of 0.99 for P2 and P3 (higher polyacrylate coating) and a value of 0.87 for P1 (Table 5) due to the fast release in the initial phase and finally the slow release rate after 45 min (x-axis value 3.8, Figure 5).
Figure 4. First order Weibull function of the experimental sodium benzoate release, lots P1, P2 and P3.
Pharmaceutics 16 01307 g004
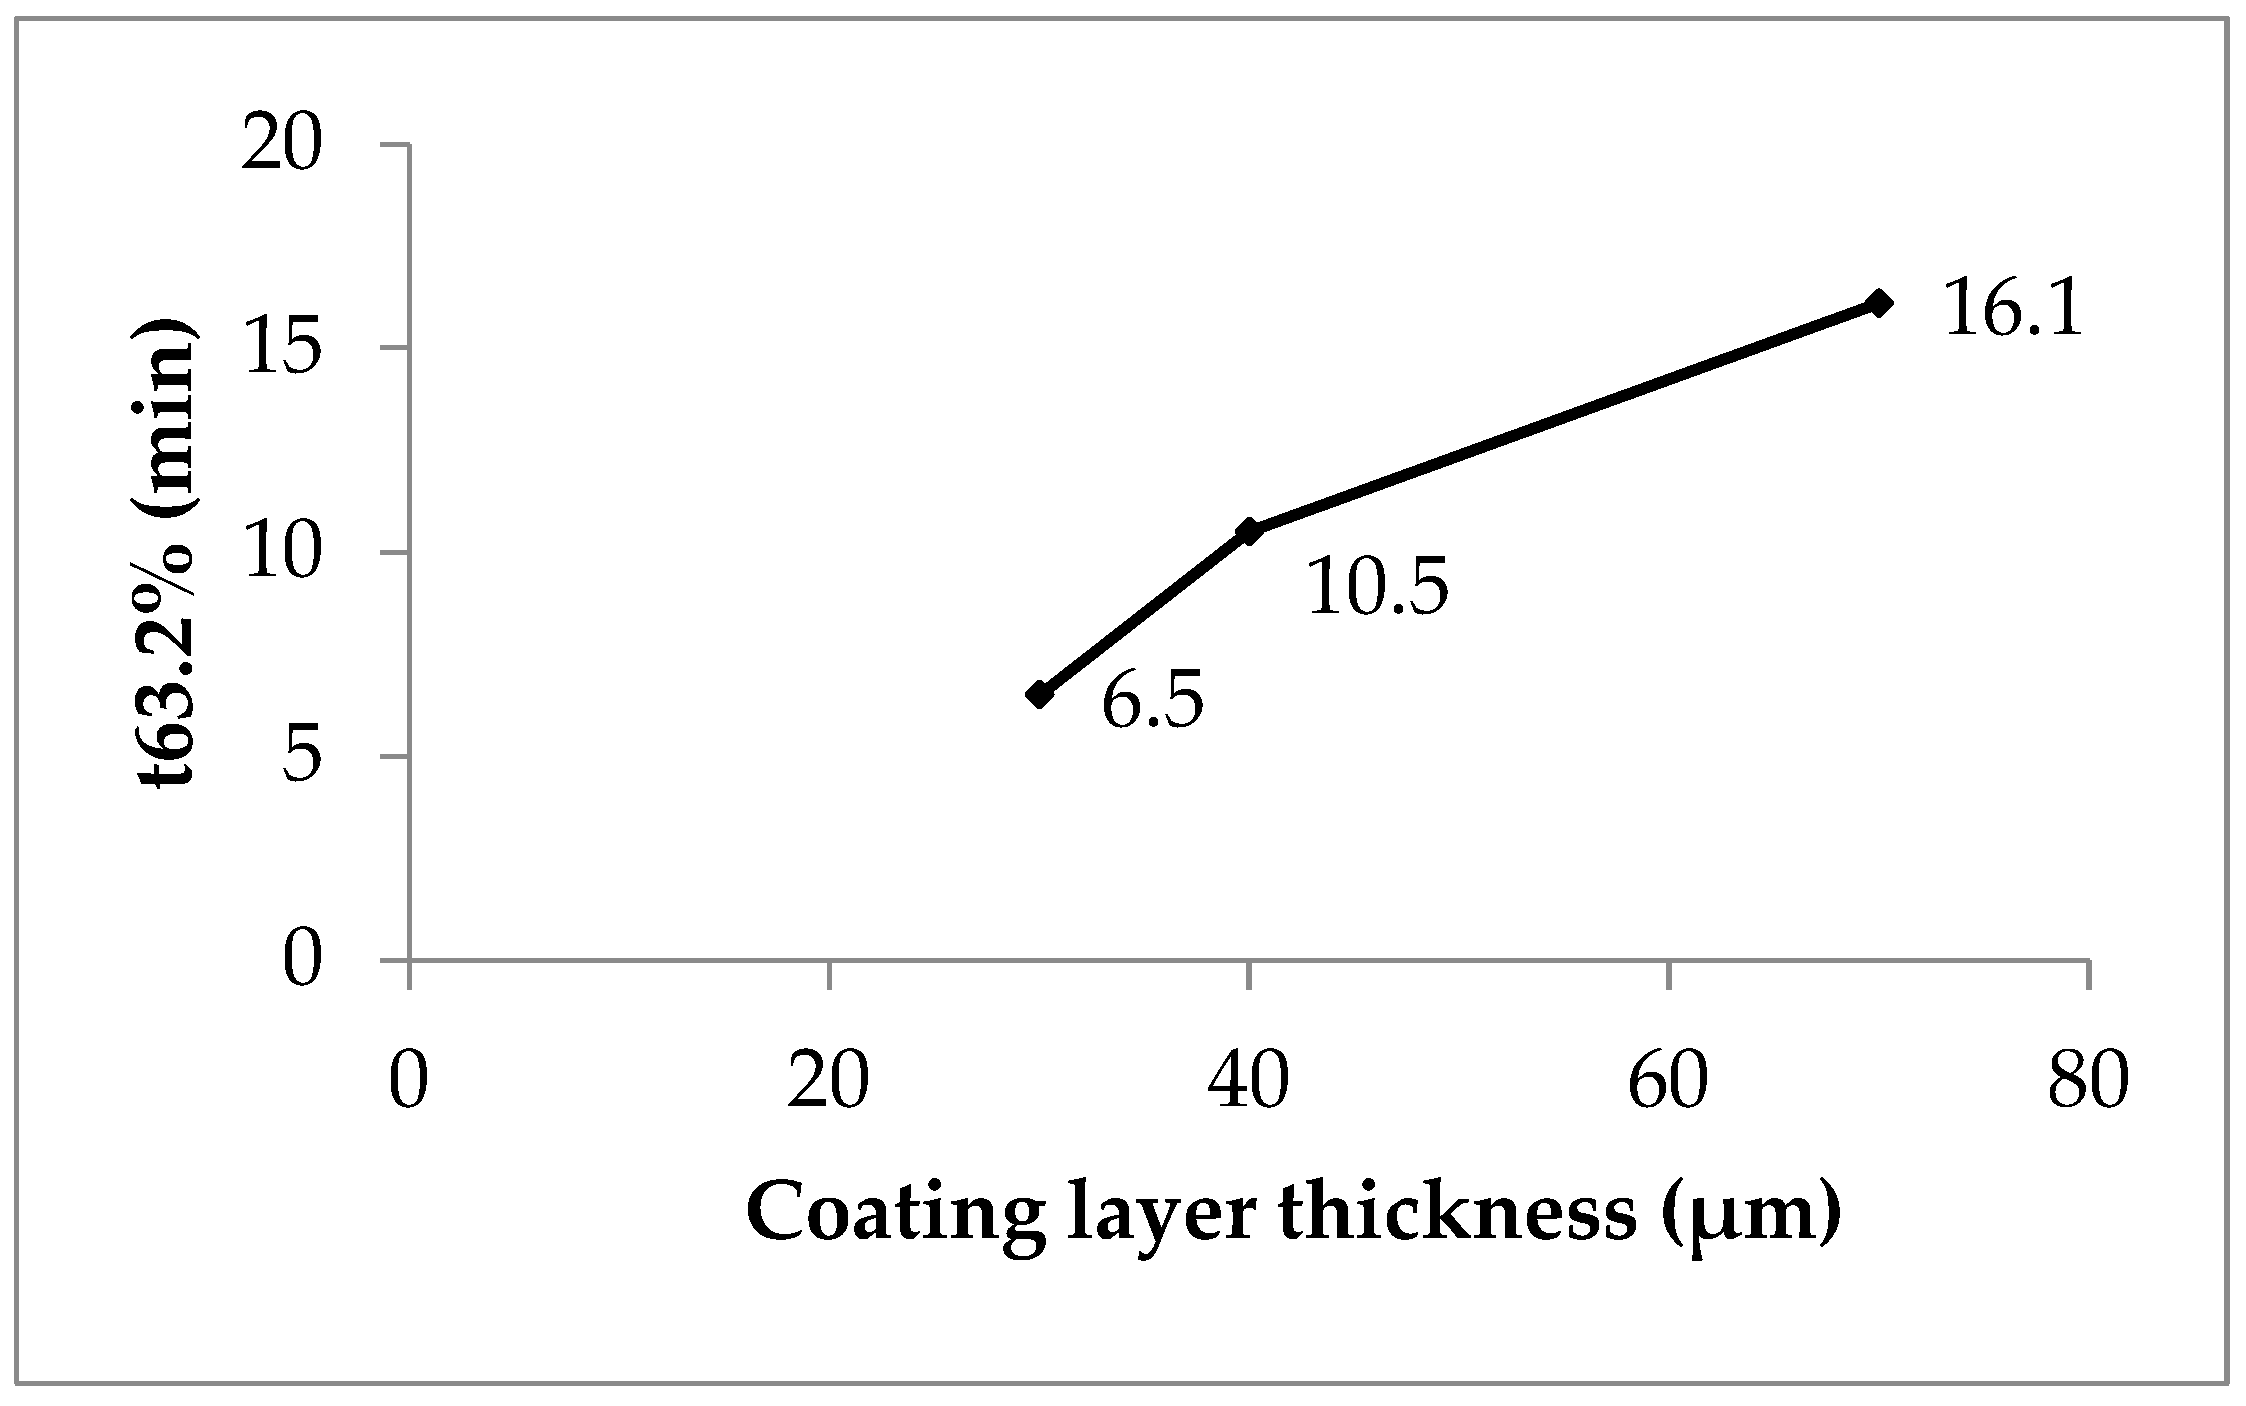
Figure 5. Weibull function release parameter t63.2% versus coating layer thickness, lots P1 (coefficient of determination 0.87, polyacrylate content 6.5%), P2 (0.99, 10.5%) and P3 (0.99, 16.1%).
Pharmaceutics 16 01307 g005

A shape parameter of 1 indicates monophasic release. In contrast, values above 1 suggest multiphasic release. In the present case, multiphasic release included an initial lag phase caused by wetting and swelling of the polyacrylate film. This was followed by an accelerated release rate up to the inflection point due to the high concentration gradient. Afterward, the rate slowed as the gradient decreased until drug dissolution and release were complete.

monophasic and multiphasic kinetics

P1, with low coating, showed nearly monophasic kinetics (shape parameter 1.08, Table 8). However, P2 (1.58) and P3 (1.36) indicated a more pronounced multiphasic release. The scale parameter (1/a) refers to the rate constant. It decreased with increasing coating thickness (Table 8). The time parameter t63.2% marks the moment when 63.2% of sodium benzoate is released. This value increased with higher polyacrylate thickness, ranging from 30 to 70 minutes (Table 8, Figure 5; see also Figure 2).

Clearly, polyacrylate coating thickness strongly influenced release kinetics (Table 4). A practical strategy for manufacturing coated pellets with controlled release is as follows. First, prepare laboratory-scale lots with increasing coating thickness. Then, measure thickness with the SFV probe. Next, investigate in vitro release and correlate it with polymer thickness. Finally, in production scale, stop the coating process once the desired thickness is detected.

3.2.4. Square Root Function

A cumulative release plot versus the square root of time yields straight lines for diffusion-controlled release. This is typical for non-disintegrating matrices such as tablets and semisolid systems (ointments, creams). Lots P1 and P2 showed nearly straight lines between 10 and 60 minutes (Figure 6). However, the initial phase (up to 10 minutes) and the terminal phase (after 60 minutes) did not fit the square root model. The CoD values ranged from 0.81 for P1 to 0.94 for P3 (Table 5). Therefore, the square root model was not suitable to describe the release from pellets with an insoluble but swellable polymer coating.

Figure 6. Square root function of the experimental sodium benzoate release, lots P1, P2 and P3.
Pharmaceutics 16 01307 g006

3.2.5. Cubic Root Function

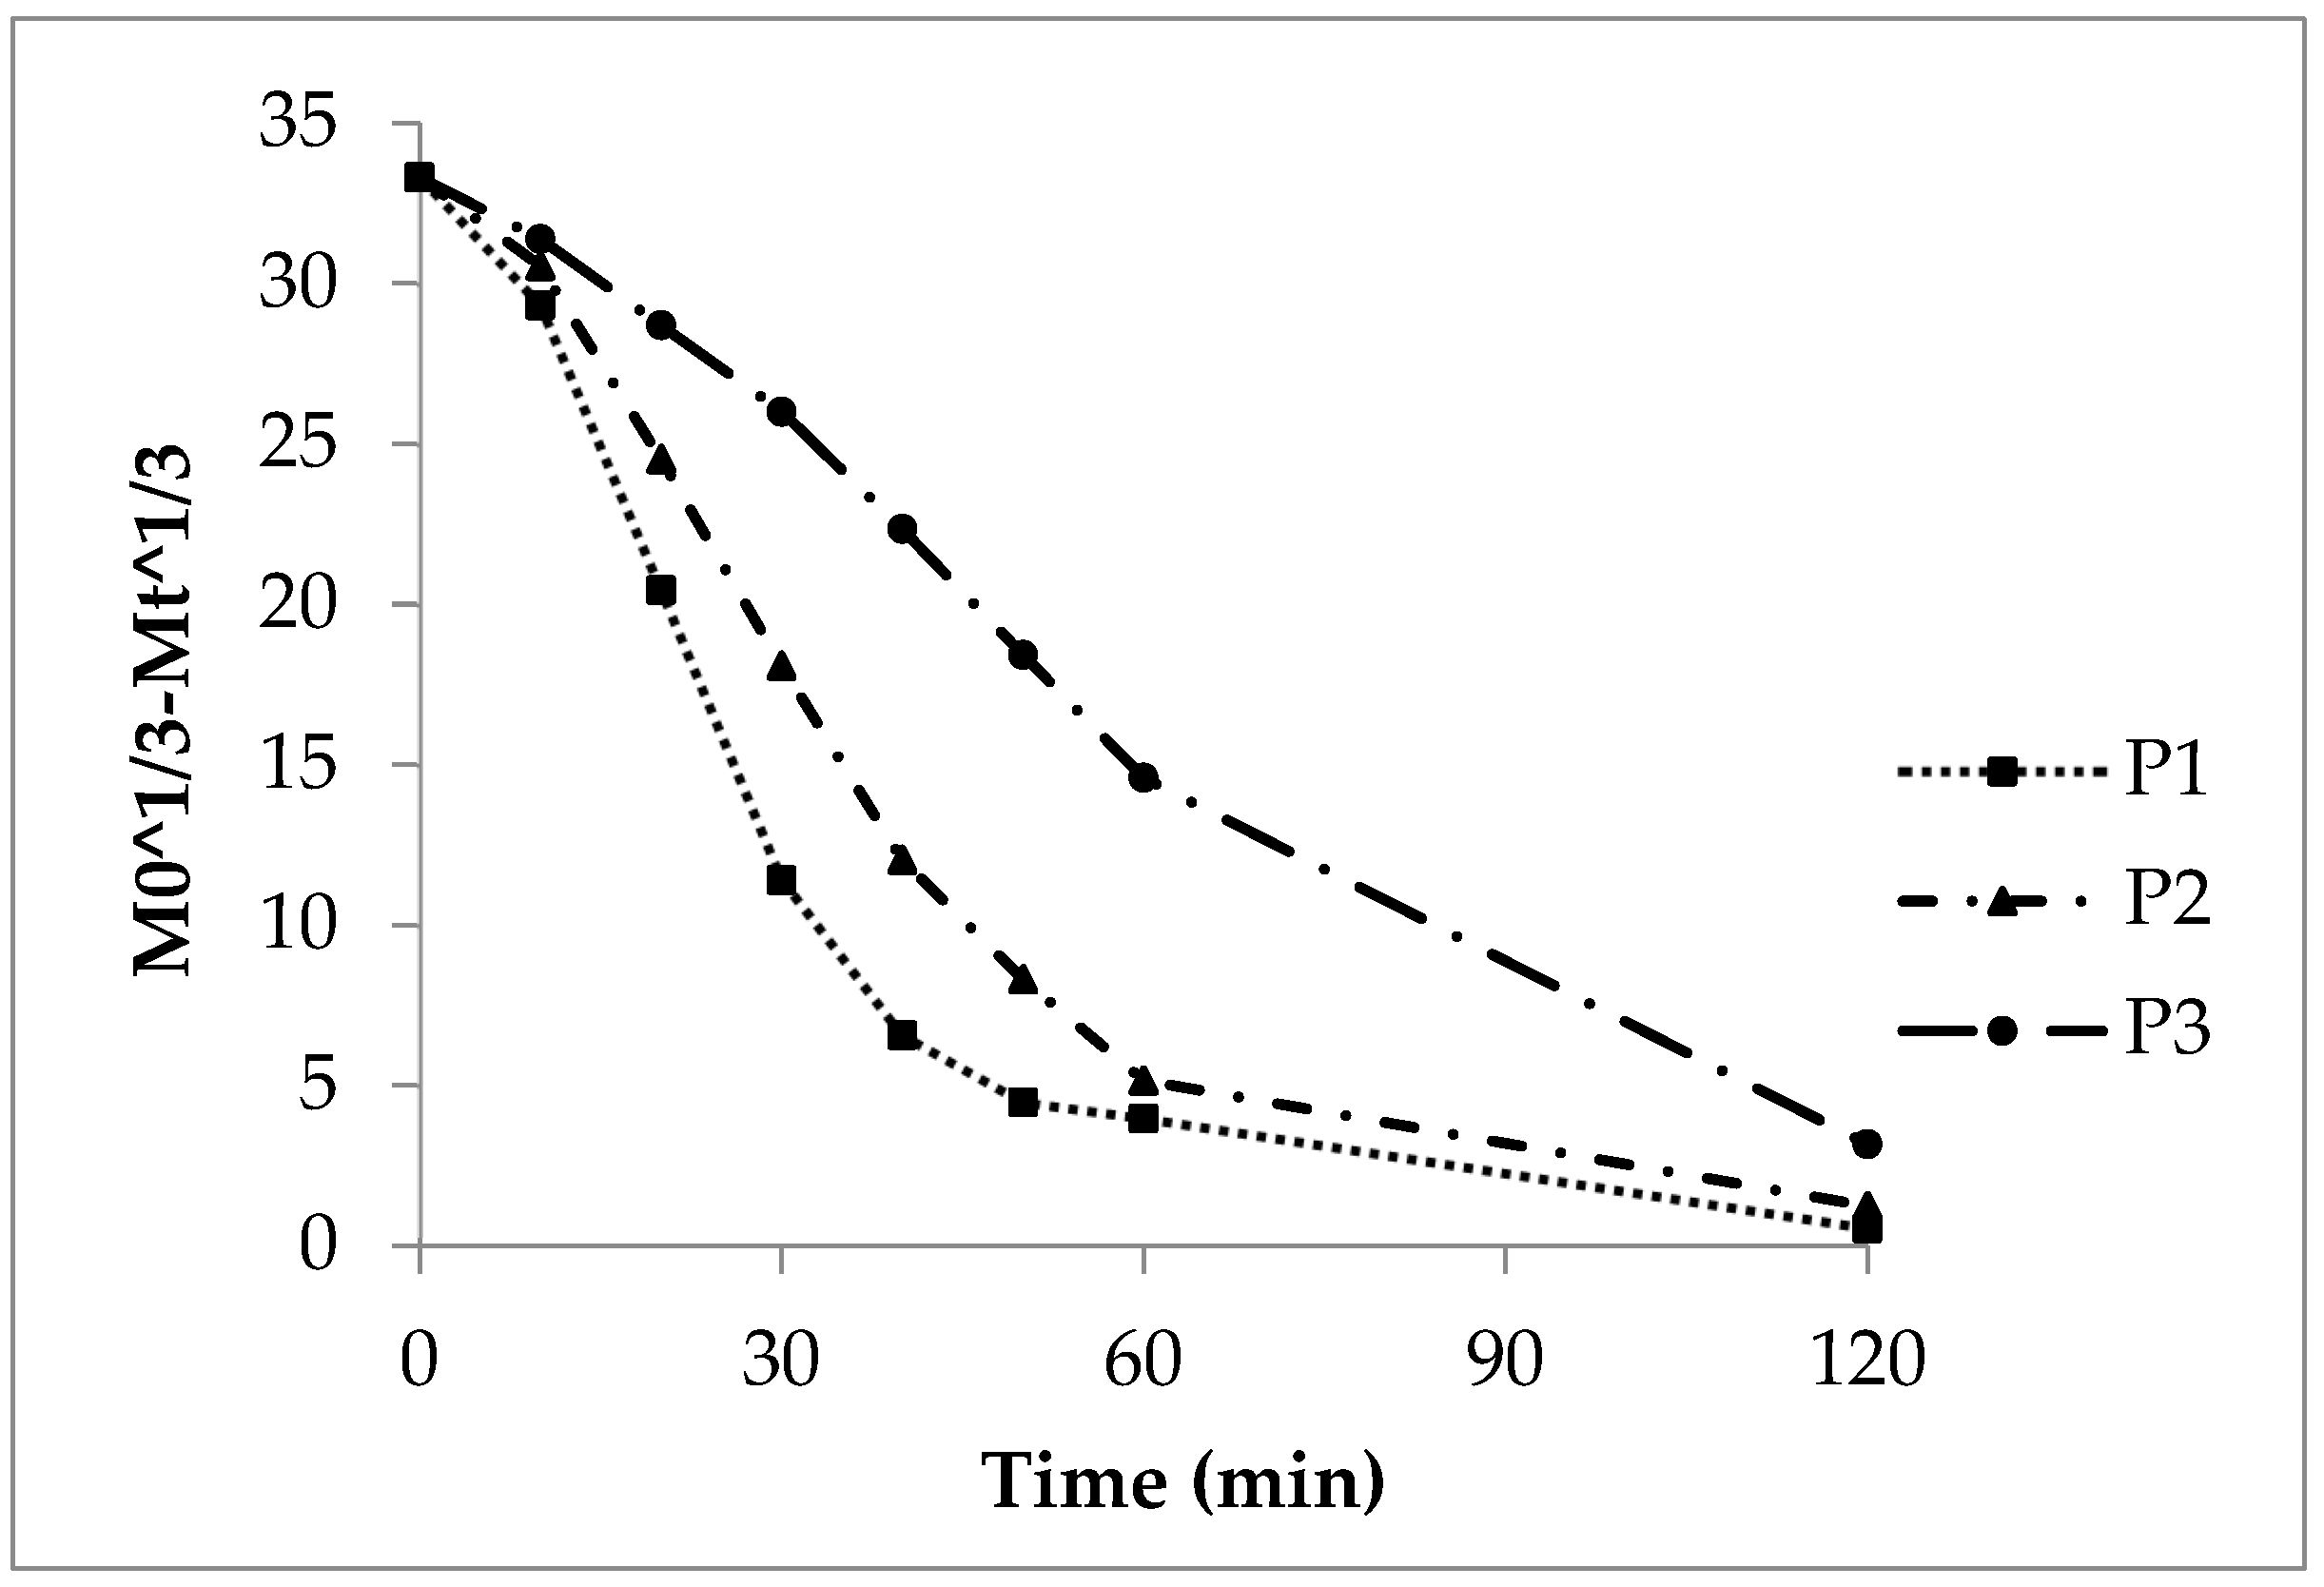
The cubic root function applies to the dissolution of spherical particles. This is because both weight and surface area decrease during dissolution. When the cubic roots of the dose and cumulative released substance are plotted against time, straight lines should appear.

However, this was not observed for sodium benzoate release from polyacrylate-coated pellets (Figure 7). The deviation from linearity was clear in lots P1 and P2, especially in the terminal release phase after 45 minutes. Their CoD values were 0.68 and 0.80, respectively (Table 5). In contrast, the slower-releasing P3 showed a nearly straight curve with a CoD of 0.98.

Thus, the cubic root model seems suitable only for pellets with thick polyacrylate coatings. Lots P1 and P2, with thinner coatings, did not follow cubic root kinetics or typical sphere dissolution.

Figure 7. Cubic root function of the experimental sodium benzoate release, lots P1, P2, and P3.

Pharmaceutics 16 01307 g007

4. Conclusions

Inert Cellets® 175 were coated in two steps. First, they received the model drug sodium benzoate. Second, they were coated with a water-insoluble polyacrylate dispersion in a fluidized bed with a Wurster inlet. Particle size increase and coating thickness were measured in-line during the entire process using the SFV probe. Sodium benzoate release was then tested in vitro. The release profiles were linearized and evaluated with different kinetic models.

As the polyacrylate coating layer thickened, the sodium benzoate release rate decreased. This trend was confirmed by release parameters, rate constants, AUC, MDT, and DE. A difference factor f1 above 15 indicated dissimilar profiles between low-coated (P1, P2) and high-coated (P3) pellets. Thus, coating thickness significantly influenced sodium benzoate release. The similarity factor f2 ranged from 67 to 74, confirming comparable release profiles across lots P1, P2, and P3.

high CoD values

The high CoD values of linearized release profiles suggested first-order kinetics as the most suitable model. This outcome can be explained by the strong effect of sodium benzoate diffusion through the swollen polyacrylate film. With thicker coatings, polymer swelling increased. Consequently, diffusion distances for water and sodium benzoate grew longer, while concentration gradients exerted stronger control over release.

Overall, the detailed study of release profiles in relation to coating thickness allows accurate detection of the coating endpoint. Therefore, the method supports manufacturing custom-coated drug pellets with defined release properties.

Authors and affiliations

Marcel Langner (1), Florian Priese (2), and Bertram Wolf (2)
1 IDT Biologika, Am Pharmapark, 06861 Dessau-Roßlau, Germany
2 Department of Applied Biosciences and Process Engineering, Anhalt University of Applied Sciences, Bernburger Straße 55, 06366 Köthen, Germany

Author Contributions

Conceptualization, B.W.; methodology, M.L.; data curation, B.W.; writing—original draft preparation, M.L.; writing—review and editing, F.P. and B.W.; supervision, F.P.; project administration, B.W.; funding acquisition, F.P. All authors have read and agreed to the published version of the manuscript.

Funding

This work was financially supported by the Federal Ministry of Education and Research of Germany (BMBF) within the research project WIGRATEC+ and the German Research Foundation (Deutsche Forschungsgemeinschaft DFG)—project number 491460386—plus the Open Access Publishing Fund of Anhalt University of Applied Sciences.

Institutional Review Board Statement

Not applicable.

Informed Consent Statement

Not applicable.

Data Availability Statement

All relevant data are available in the article.

Conflicts of Interest

The authors declare no conflicts of interest.

Notations

M0 initial drug dose, drug content (%)
Mt released drug amount at time (%)
AUC area under the curve (%*min)
DE dissolution efficiency (-)
MDT mean dissolution time (min)
Ti released drug amount at moment t test formulation (%)
Ri released drug amount at moment t reference formulation (%)
n number of time points (-)
I release time point (min)
T moment of drug release (min)
k0 release rate constant, zero order release kinetics (%/min)
k1 release rate constant, first order release kinetics (1/min)
kq release rate constant, square root release kinetics (-)
kc release rate constant, cubic root release kinetics (-)
1/a scale parameter of Weibull function (-)
b shape parameter of Weibull function (-)
x50.3 median of volume density distribution (µm)
R2 coefficient of determination (CoD) (-)
A cross section area (m2]
D diffusion coefficient (cm2/s)
dn/dt transport flow (mol/min)
dc/dx concentration gradient (mol/l*m)
f1 difference factor (-)
f2 similarity factor (-)

Abbreviations

CoD coefficient of determination
P1, P2, P3 coated pellet lots, experimental release
P1cal, P2cal, P3cal coated pellet lots, calculated release
Ph.Eur. European Pharmacopoeia
pKa logarithmic acid dissociation constant
PVP polyvinylpyrrolidone
rpm rotation per minute
SB pellets sodium benzoate coated pellets
SFV spatial filter velocimetry

References

  1. Koch, H.P. Die Technik der Dissolutionsbestimmung. Teil 2. Experimentelle Methodik, Auflösungsgesetze, Auswertung und graphische Darstellung der Ergebnisse, Kenngrößen der Dissolution, Korrelation. Pharm. Acta Helv. 1984, 59, 130–139. [Google Scholar]
  2. Yonezawa, Y.; Kawase, S.; Sasaki, M.; Shinohara, I. Dissolution of solid dosage form. V. New form equations for the non-sink dissolution of a monodisperse system. Chem. Pharm. Bull. 1995, 43, 304–310. [Google Scholar] [CrossRef]
  3. Pereira de Almeida, L.; Simões, S.; Brito, P.; Portugal, A.; Figueiredo, M. Modeling dissolution of sparingly soluble multisized powders. J. Pharm. Sci. 1997, 86, 726–732. [Google Scholar] [CrossRef] [PubMed]
  4. Liu, Y.; Sun, Y.; Sun, J.; Zhao, N.; Sun, M.; He, Z. Preparation and in vitro/in vivo evaluation of sustained-release venlafaxine hydrochloride pellets. Int. J. Pharm. 2012, 426, 21–28. [Google Scholar] [CrossRef]
  5. Javadzadeh, Y.; Monajjemzadeh, F.; Safaei, E.; Adibkia, K.H. Release kinetics of sodium diclofenac from controlled release device. Pharm. Ind. 2014, 76, 1786–1793. [Google Scholar]
  6. Viswanadha, L.S.; Arcot, Y.; Lin, Y.-T.; Akbulut, M.E.S. A comparative investigation of release kinetics of paclitaxel from natural protein and macromolecular nanocarriers in nanoscale drug delivery systems. J. Colloid Interf. Sci. Open 2024, 15, 100120. [Google Scholar] [CrossRef]
  7. Wang, J.; Sun, Y.; Li, B.; Fan, R.; Li, B.; Yin, T.; Rong, L.; Sun, J. Preparation and evaluation of tamsulosin hydrochloride sustained-release pellets modified by two-layered membrane techniques. Asian J. Pharm. Sci. 2015, 10, 31–39. [Google Scholar] [CrossRef]
  8. Kovacevic, J.; Mladenovic, A.; Djuris, J.; Ibric, S. Evaluation of powder, solution and suspension layering for the preparation of enteric coated pellets. Eur. J. Pharm. Sci. 2016, 85, 84–93. [Google Scholar] [CrossRef]
  9. Cascone, S. Modeling and comparison of release profiles: Effect of the dissolution method. Eur. J. Pharm. Sci. 2017, 106, 352–361. [Google Scholar] [CrossRef]
  10. Marucci, M.; Andersson, H.; Hjärtstam, J.; Stevenson, G.; Baderstedt, J.; Stading, M.; Larsson, A.; Corswant, C. New insights on how to adjust the release profile from coated pellets by varying the molecular weight of ethyl cellulose in the coating film. Int. J. Pharm. 2013, 458, 218–223. [Google Scholar] [CrossRef]
  11. Xu, M.; Liew, C.V.; Heng, P.W.S. Evaluation of the coat quality of sustained release pellets by individual pellet dissolution methodology. Int. J. Pharm. 2015, 478, 318–327. [Google Scholar] [CrossRef]
  12. Villar López, E.; Luzardo Álvarez, A.; Blanco Méndez, J.; Otero Espinar, F.J. Cellulose-polysaccharide film-coating of cyclodextrin based pellets for controlled drug release. J. Drug Deliv. Sci. Technol. 2017, 42, 273–283. [Google Scholar] [CrossRef]
  13. Sousa, J.J.; Sousa, M.J.; Moura, M.J.; Podczeck, F.; Newton, J.M. The influence of core materials and film coating on the drug release from coated pellets. Int. J. Pharm. 2002, 233, 111–122. [Google Scholar] [CrossRef] [PubMed]
  14. Krueger, C.; Thommes, M.; Kleinebudde, P. Influence of storage conditions on properties of MCC II-based pellets with theophylline-monohydrate. Eur. J. Pharm. Biopharm. 2014, 88, 483–491. [Google Scholar] [CrossRef]
  15. Albanez, R.; Nitz, M.; Pereira Taranto, O. Influence of the type of enteric coating suspension, coating layer and process conditions on dissolution profile and stability of coated pellets of diclofenac sodium. Powder Technol. 2015, 269, 185–192. [Google Scholar] [CrossRef]
  16. Kazlauske, J.; Cafaro, M.M.; Caccavo, D.; Marucci, M.; Lasson, A. Determination of the release mechanism of theophylline from pellets coated with Surelease®—A water dispersion of ethyl cellulose. Int. J. Pharm. 2017, 528, 345–353. [Google Scholar] [CrossRef]
  17. Hiew, T.N.; Siew, L.W.; Wannaphatchaiyong, S.; Elsergany, R.N.; Pichayakorn, W.; Boonme, P.; Heng, P.W.S.; Liew, C.V. Influence of talc and hydrogenated castor oil on the dissolution behavior of metformin-loaded pellets with acrylic-based sustained release coating. Int. J. Pharm. 2023, 640, 122984. [Google Scholar] [CrossRef]
  18. Alagili, M.F.; AlQuadeib, B.T.; Ashri, L.Y.; Ibrahim, M.A. Optimization and evaluation of Lisinopril mucoadhesive sustained release matrix pellets: In-vitro and ex-vivo studies. Saudi Pharm. J. 2023, 31, 101690. [Google Scholar] [CrossRef]
  19. Wu, S.; Zeng, Q.; Zhang, Z.; Zhang, X.; Hou, Y.; Li, Z.; Jia, C.; Liu, Y.; Li, W. Development of sinomenine hydrochloride sustained-release pellet using a novel whirlwind fluidized bed. J. Drug Deliv. Sci. Technol. 2022, 78, 103956. [Google Scholar] [CrossRef]
  20. Muschert, S.; Siepmann, F.; Leclercq, B.; Carlin, B.; Siepmann, J. Prediction of drug release from ethylcellulose coated pellets. J. Control Release 2009, 135, 71–79. [Google Scholar] [CrossRef]
  21. Yang, M.; Xie, S.; Li, Q.; Wang, Y.; Chang, X.; Shan, L.; Sun, L.; Huang, X.; Gao, C. Effects of polyvinylpyrrolidone both as a binder and pore-former on the release of sparingly water-soluble topiramate from ethylcellulose coated pellets. Int. J. Pharm. 2014, 465, 187–196. [Google Scholar] [CrossRef] [PubMed]
  22. Dekyndt, B.; Verin, J.; Neut, C.; Siepmann, F.; Siepmann, J. How to easily provide zero order release of freely soluble drugs from coated pellets. Int. J. Pharm. 2015, 478, 31–38. [Google Scholar] [CrossRef] [PubMed]
  23. Thapa, P.; Thapa, R.; Choi, D.H.; Jeong, S.H. Effect of pharmaceutical processes of the quality of ethylcellulose coated pellets: Quality by Design approach. Powder Technol. 2018, 339, 25–38. [Google Scholar] [CrossRef]
  24. Kaur, S.; Sivasankaran, S.; Wambolt, E.; Jonnalagadda, S. Determinants of zero-order release kinetics from acetaminophen-layered Suglet® pellets, Wurster-coated with plasticized Aquacoat® ECD (ethyl cellulose dispersion). Int. J. Pharm. 2020, 573, 118873. [Google Scholar] [CrossRef]
  25. Kállai, N.; Luhn, O.; Dredán, J.; Kovács, K.; Lengyel, M.; Antal, I. Evaluation of drug release from coated pellets based on isomalt, sugar and microcrystalline cellulose inert cores. AAPS PharmSciTech 2010, 11, 383–391. [Google Scholar] [CrossRef]
  26. Priese, F.; Wolf, B. Development of high drug loaded pellets by Design of Experiment and population balance model calculation. Powder Technol. 2013, 241, 149–157. [Google Scholar] [CrossRef]
  27. Wiegel, D.; Eckardt, G.; Priese, F.; Wolf, B. In-line particle size measurement and agglomeration detection of pellet fluidized bed coating by Spatial Filter Velocimetry. Powder Technol. 2016, 301, 261–267. [Google Scholar] [CrossRef]
  28. Petrak, D.; Eckardt, G.; Dietrich, S.; Köhler, M.; Wiegel, D.; Wolf, B.; Priese, F.; Jacob, M. In-line measurement of layer thickness, agglomerate fraction and spray drying during pellet coating in the fluidized bed. Pharm. Ind. 2018, 80, 262–270. [Google Scholar]
  29. Priese, F.; Frisch, T.; Wolf, B. Comparison of film-coated retarded release pellets manufactured by layering technique or by fluidized bed rotor pelletization. Pharm. Dev. Technol. 2015, 20, 417–424. [Google Scholar] [CrossRef]
  30. Juhász, A.; Ungor, D.; Berta, K.; Seres, L.; Csapó, E. Spreadsheet-based nonlinear analysis of in vitro release properties of a model drug from colloidal carriers. J. Mol. Liq. 2021, 328, 115405. [Google Scholar] [CrossRef]
  31. European Pharmacopoeia 11.5, 2024. Available online: https://pheur.edqm.eu/subhome/11-5 (accessed on 29 August 2024).
fig-3_Plasticity of Microcrystalline Cellulose Spheres

Abstract

Compaction pressure can induce an undesirable solid-state polymorphic transition in drugs, fragmentation, loss of coated pellet integrity, and the decreased viability and vitality of microorganisms. Thus, the excipients with increased plasticity can be considered as an option to decrease the undesirable effects of compaction pressure. This study aims to increase the plasticity (to reduce the mean yield pressure; Py) of dried microcrystalline cellulose (MCC) by loading it with a specially selected plasticizer. Diethyl citrate (DEC), water, and glycerol were the considered plasticizers. Computation of solubility parameters was used to predict the miscibility of MCC with plasticizers (possible plasticization effect). Plasticizer-loaded MCC spheres with 5.0 wt.% of water, 5.2 wt.% of DEC, and 4.2 wt.% glycerol were obtained via the solvent method, followed by solvent evaporation. Plasticizer-loaded formulations were characterised by TGA, DSC, pXRD, FTIR, pressure-displacement profiles, and in-die Heckel plots. Py was derived from the in-die Heckel analysis and was used as a plasticity parameter. In comparison with non-plasticized MCC (Py = 136.5 MPa), the plasticity of plasticizer-loaded formulations increased (and Py decreased) from DEC (124.7 MPa) to water (106.6 MPa) and glycerol (99.9 MPa), and that was in full accordance with the predicted miscibility likeliness order based on solubility parameters. Therefore, water and glycerol were able to decrease the Py of non-plasticized MCC spheres by 16.3 and 30.0%, respectively. This feasibility study showed the possibility of modifying the plasticity of MCC by loading it with a specially selected plasticizer.

References to “The Increase in the Plasticity of Microcrystalline Cellulose Spheres’ When Loaded with a Plasticizer”

Authors: Artūrs Paulausks, Tetiana Kolisnyk and Valentyn Mohylyuk

First published: Pharmaceutics 2024, 16(7), 945; https://doi.org/10.3390/pharmaceutics16070945

1. Introduction

Being non-invasive and, in most cases, not requiring medical assistance, tablets for oral administration are the most widespread and the most popular pharmaceutical and nutraceutical dosage forms. Despite the rising topic of individualised/personalised medicine, including individualised dosing, drug release, and customer properties, national healthcare systems worldwide are highly dependent on the mass-market production of tablets and their usage following treatment protocols.
In the vast majority of cases, pharmaceutical substances cannot be converted into tablets via tableting with high-speed rotary tablet presses [1]. To achieve the desirable mechanical and biopharmaceutical properties, specific excipients are required. Appropriate mechanical properties, such as tablet hardness (or tensile strength) and abrasion resistance (friability) should ensure tablet applicability to transportation, coating, and packaging processes without losing their appearance, dose, and biopharmaceutical properties. Moreover, the intrinsic properties of tablet excipients and the structural-mechanical properties of the tablets formed eventually affect the disintegration and drug release behaviour of the dosage form, and so, can be deliberately selected to achieve the desired release profile [2].
Upon tableting, the compaction pressure and tableting speed (dwell time) induce elastic and plastic deformation, or fragmentation, and affect the extent of these deformations [3]. The tableting cycle can be described with a force–displacement profile: the distance between punches, which is plotted against the compaction pressure or force. This can be determined with state-of-the-art equipment, such as compaction simulators containing hi-tech sensors and sophisticated user-friendly software [4,5].
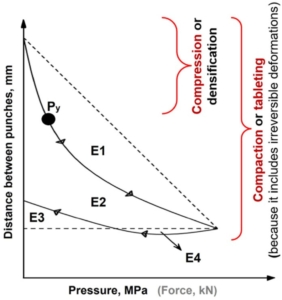
fig-1_Plasticity of Microcrystalline Cellulose Spheres

Figure 1. An example of a force-displacement profile highlighting: the rearrangement energy (E1), plastic energy (E2 + E4), elastic energy (E3; or energy lost), plastic flow energy (E4), compaction energy (E1 + E2 + E3), and mean yield pressure (Py). The arrows on the curve are showing the direction of curve development.

Considering the true density of the material, an in-die Heckel plot can be built: ln(1/porosity) is plotted against the compaction pressure. The greater the slope of the linear region (K), the greater the degree of plasticity of the material [6]. The mean yield pressure (Py) of the solid is reciprocal to K [7] and describes the point after which the deformation is irreversible (pointed out in Figure 1). It should be stressed that the mean yield pressure from the in-die Heckel analysis can be used as a reliable plasticity parameter: the lower the Py, the greater the degree of plasticity of the material [8].
Possessing information about the Py of each ingredient in the blend allows predicting the sequence of the events of the material irreversible deformations upon tableting cycle. Consequently, the targeted composition of a tableting blend based on excipients’ Py can predetermine the deformation (the extent of deformation) of the specific ingredients in this blend upon tableting at a specific compaction pressure [9]. Considering the possibility of undesirable solid-state polymorphic transition of the drug [10,11], particle fragmentation, the loss of coated pellet integrity [12,13], and the decreased viability and vitality of microorganisms [14,15] as a function of compaction pressure, the above-mentioned circumstances are of particular interest.
Microcrystalline cellulose (MCC) is a partially depolymerised, naturally occurring polymer in the form of crystalline powder or spheroids composed of porous particles [16], and it is one of the most commonly used excipients in tablet formulations [17]. MCC is used for direct compression (up to 90 wt.%), dried granulation/roll-compaction, and wet granulation to achieve tablets with desirable mechanical and biopharmaceutical properties [3,10,16]. MCC is recognised as an excipient with relatively low Py that undergoes plastic deformation at relatively low compression forces [3].
The effect of water on the plasticization of the MCC as well as its effect on the compaction properties upon tableting has been previously reported [18,19,20]. To the best of our knowledge, the information regarding MCC plasticization with other solvents or excipients in order to influence the compaction properties upon tableting is lacking. Nevertheless, the practice of modulating cellulose derivatives plasticity for film forming [21,22], hot-melt extrusion, and/or fusion deposition modelling 3D-printing [23,24] is common practice. While solubility parameters were found to be a useful instrument for plasticizer pre-screening [24,25].
This study aims to increase the plasticity (to reduce the Py) of MCC by loading it with a specially selected (based on the solubility parameters) plasticizer. It was assumed that a lower Py of the MCC could enable tablets to be prepared at lower compaction pressure and decrease the undesirable effect of compaction pressure.

2. Materials and Methods

2.1. Materials

CELLETS® 500 MCC cores (lot# 21E1034; IPC Process-Center GmbH & Co KG, Grunaer Weg, Germany) were used as the starting cores. The rest of the chemicals used for the experiment, such as diethyl citrate (DEC), glycerol, and methanol were of Pharmacopeia grade and used as received.

2.2. Theoretical Solubility Parameter Computation

The drug–polymer miscibility was assessed theoretically via calculations of Hansen solubility parameters (HSPs) via the group contributions methodology. Thus, the energies of dispersion forces (Ed), polar forces (Ep), and hydrogen bonding (Eh) gave the dispersion (δd), polar (δp), and hydrogen bonding (δh) partial solubility parameters, respectively [26,27].
All calculations were performed using the Hansen Solubility Parameters in Practice (HSPiP) software (5th edition, version 5.1.03). In this study, we calculated HSPs for cellulose and DEC, while HSPs for water and glycerol were taken from the software database. It should be noted that the HSPiP database includes three sets of HSPs for water: one of them is derived from the energy of vaporisation of water at 25 °C and relates to a single molecule, whereas the other two relate to six-molecule associates which are more typical for water in a liquid state [28]. In this regard, the set of HSPs for water as associated units (based on a correlation of total miscibility with certain solvents) were used in this study.
HSPs for cellulose and DEC were calculated using the following HSPiP software DIY methods: the Yamamoto-molecular break (Y-MB), in which the components were input as simplified molecular input line entry syntax (SMILES) codes; the Van Krevelen method where the components were entered by accounting for chemical constituents and taking molar volumes from Y-MB calculations; and the Hoy method with similar input procedure as the latter one. Finally, the average HSP values within all three methods were determined.
The assessment of MCC–plasticizer miscibility was accomplished by comparing HSPs calculated according to three approaches that are based on the principle ‘like dissolves like’ [29].

The approach authored by Van Krevelen and Hoftyzer estimates a high likelihood of successful mixing of two substances if the parameter ΔδT (Equation (1)) is not more than 5 MPa0.5, while complete immiscibility occurs when ΔδT exceeds 10 MPa0.5 [30,31].

ΔδT = ((δd1 − δd2)2 + (δp1 − δp2)2 + (δh1 − δh2)2)0.5

By Bagley’s approach, the drug–polymer miscibility is evaluated using the combined solubility parameter δv (Equation (2)).

δv = (δd2 + δp2)0.5

The probability of miscibility is concluded if the distance between two points in the two-dimensional plot is D12 ≤ 5.0 (Equation (3)) [31].

D12 = ((δv1 − δv2)2 + (δh1 − δh2)2)0.5

The approach by Greenhalgh evaluates the miscibility as the absolute difference Δδt (Equation (4)) between the total solubility parameters δt which are calculated from Equation (5).

Δδt = |δt1 − δt2|
δt = (δd2 + δp2 + δh2)0.5
According to the latter approach, drug–polymer miscibility was assumed to be likely if Δδt ≤ 7, while Δδt ≥ 10 MPa0.5 indicated immiscibility [27].

2.3. Plasticizer Loading onto MCC Cores Using Solvent Evaporation Method

To obtain glycerol- and DEC-loaded MCC spheres, the initial MCC spheres were dried in a vacuum oven, and their water content after drying was confirmed by Karl-Fisher (V10S; Mettler-Toledo GmbH, Greifensee, Switzerland) titration at the level of 0.1 wt.%. Two batches of plasticizer-loaded MCC spheres were made, one with DEC, using methanol as a solvent, and another with glycerol, using water as a solvent (Table 1).
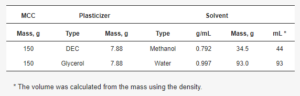
table-1

Table 1. Used amounts of plasticizer and solvent for the plasticizer loading procedure.

About 150 g of MCC was weighed in a 500 mL round-bottom flask. Afterwards, the amount of solvent was calculated using the MCC/solvent ratio obtained from the MCC solvent absorption test. The excess solvent amount (that which could be absorbed and adsorbed by the MCC sphere) was used. The appropriate amount of plasticizer to achieve 5% loading was dissolved in the solvent. The plasticizer solution was added to MCC in a round-bottom flask (total volume of about 250 mL) and shaken vigorously by hand. The solvent was removed by a rotary evaporator (RV3 eco, from IKA-Werke GmbH & Co. KG, Staufen, Germany) at 50 °C under a pressure of 100 mbar. After that, each sample was additionally dried with dry air (50 m3/h) in a fluid-bed drier (Mini-Glatt; Glatt GmbH, Binzen, Germany) at 50 °C until constant outlet air temperature.

2.4. Thermogravimetric Analysis (TGA)

The thermal behaviour of the samples was examined using Thermal Advantage Q50 TGA (TA Instruments, New Castle, DE, USA). The samples (5–10 mg) were heated in an open aluminium pan at a heating rate of 5 °C/min or 50 °C/min from room temperature to 350 °C. Nitrogen was used as a purge gas at a flow rate of 50 mL/min for all TGA experiments. The weight remaining (%) was plotted as a function of temperature (°C). The weight loss (dM) between starting/room temperature (RT) and 200 ℃ (RT-200 °C) and temperature onset of degradation (Td onset) were determined for each formulation. Data was processed with a Universal V4.5A software (TA Instruments, USA) [32].

2.5. Differential Scanning Calorimetry (DSC)

To investigate the thermal properties of the sample before and after processing, a heat-flux DSC (DSC Q20; TA Instruments, USA) was conducted to characterise thermal behaviour. For measurement, the samples were weighed (5–8 mg) into aluminium DSC pans and heated from −10 °C to 390 °C at 50 °C/min with a continuous purge of nitrogen gas at 50 mL/min. Melting temperature onset (Tm onset), melting peak temperature (Tm peak), and melting enthalpy were determined for each formulation. The data were processed with Universal V4.5A software (TA Instruments, USA) [10].

2.6. Powder X-ray Diffraction (pXRD) Analysis

The study was conducted on a diffractometer (RigakuTM Miniflex 600 C; Rigaku Co., Tokyo, Japan) in θ/2θ geometry at ambient temperature using CuKα X-radiation (λ = 1.54182 Å) at 40 kV and 15 mA power. X-ray diffraction patterns were collected over the 2θ range of 3–60° at a 5°/min scan rate. The ground sample was applied to the low-background silicone sample holder.

2.7. Fourier-Transform Infrared (FTIR) Attenuated Total Reflectance (ATR) Spectroscopy

FTIR-ATR study of the samples was performed on a FTIR Spectrometer (Nicolete IS20, Thermo Scientific, Karlsruhe, Germany) using a diamond prism by scanning from 4000 to 400 cm−1, with 2.0 cm−1 resolution and 100 scans per spectrum (the background was taken before each sample). Every graphically represented FTIR-profile was obtained by averaging 3 spectra.

2.8. Scanning Electron Microscopy (SEM) and Particle Size Distribution Analysis

SEM pictures were captured with a microscope (TM3030; Hitachi High-Tech Corp., Tokyo, Japan) in a vacuumed environment at 15 kV to obtain information about morphology on a microscopic level. The particle size distribution (D10%, D50%, and D90%) of the MCC spheres was determined using image analysis coupled with a VIBRI feeder and a RODOS disperser (series QICPIC/L02; Sympatec GmbH, Clausthal-Zellerfeld, Germany).

2.9. Preparation of Tablets

The samples (Table 2) were tableted with 11.28 mm flat punches to obtain a target mass of 500 mg using the compaction simulator STYL’One Nano (Medelpharm, Beynost, France/Korsch, Berlin, Germany). Compression cycles of a small rotary press with a turret diameter of 180 mm, a precompression roll diameter of 44 mm, an angle between rollers of 65 degrees, a compression roll diameter of 160 mm, an angle between main compression and the beginning of the compression ramp of 60 degrees, an angle of the ejection ramp of 20 degrees at a tableting speed of 70 rpm (maximum for STYL’One Nano), a precompression and compression forces of 5 and 30 kN (equivalent of 50 and 300 MPa) were used [9].
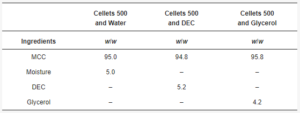
table-2

Table 2. Formulations for tableting.

2.10. The Theoretical True Density Calculation

The theoretical true density of tablet composition was calculated based on the pycnometric density (ρt) of MCC (1.586 g/cm3) [16,33], glycerol (1.262 g/cm3) [34], DEC (1.287 g/cm3) [35], and their shares (x, w/w) using the additive methodology and the following equation [1]:

𝜌𝑡=(𝜌𝑀𝐶𝐶×𝑥𝑀𝐶𝐶)+(𝜌𝑒𝑥𝑐×𝑥𝑒𝑥𝑐)ρt=ρMCC×xMCC+ρexc×xexc

2.11. In-Die Heckel Plot Construction

The relative density (ln(1/ε)) was calculated automatically with Alix software ver. 20220711 (Medelpharm, Beynost, France) [4]. The relative density and compaction pressure (P, MPa) data were plotted by the Heckel relationship [6]:

𝑙𝑛(1/𝜀)=𝐾×𝑃+𝑙𝑛(1/𝜀0)=𝐾×𝑃+𝐴ln⁡(1/ε)=K×P+ln⁡1/ε0=K×P+A

where: K is the slope of the linear region (the proportionality constant), and ln(1/ε0) is a constant, A, that represents the intercept/ degree of packing (at porosity ε0) achieved at low pressure because of the rearrangement process before an appreciable amount of interparticle bonding takes place. The mean yield pressure (Py, MPa) was calculated in accordance with Hersey and Rees by the equation [3,7,36]:

𝑃𝑦=1𝐾Py=1K
The mean yield pressure was measured (n = 10 for each formulation) in the pressure range between 70 and 210 MPa. A one-way ANOVA (analysis of variance) test was used to compare the means of two groups using the built-in possibilities of the current version of Excel (Microsoft 365; Redmond, Washington, DC, USA; Supplementary Materials).

3. Results and Discussion

MCC is manufactured by hydrolysis with dilute mineral acid solutions of α-cellulose sourced from raw plant material. After hydrolysis, the hydrocellulose is filtered, and the aqueous slurry is spray-dried. Thus, the MCC as an excipient contains up to 7 wt.% of moisture in accordance with pharmacopoeia (JP, PhEur, and USP) [16]. Theoretical solubility parameters were used to obtain three values (ΔδT, D12, and Δδt) to assess the possible miscibility of cellulose with water, glycerol, and DEC (Table 3, Figure 2).
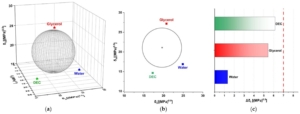
fig-2_Plasticity of Microcrystalline Cellulose Spheres

Figure 2. Evaluation of MCC–plasticizer miscibility using averaged solubility parameters: 3D approach authored by Hoftyzer and Van Krevelen (a), 2D Bagley’s plot (b), and 1D bar graph according to Greenhalgh (c).
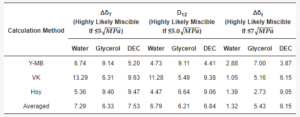
table-3

Table 3. Hansen solubility parameter calculations.

According to values averaged from the Y-MB, VK, and Hoy methods, the possible miscibility of all three plasticizers (below the proposed threshold; Table 2) was predicted only by Greenhalgh’s approach (based on Δδt calculation) which showed the following miscibility likeliness order: water > glycerol > DEC. At the same time, the other two approaches authored by Van Krevelen and Bagley, respectively, indicated that possible miscibility fell into an ambiguous region between 5 and 10 MPa0.5 for all studied plasticizers; however, the same likeliness order (glycerol > water > DEC) was established for both of them.
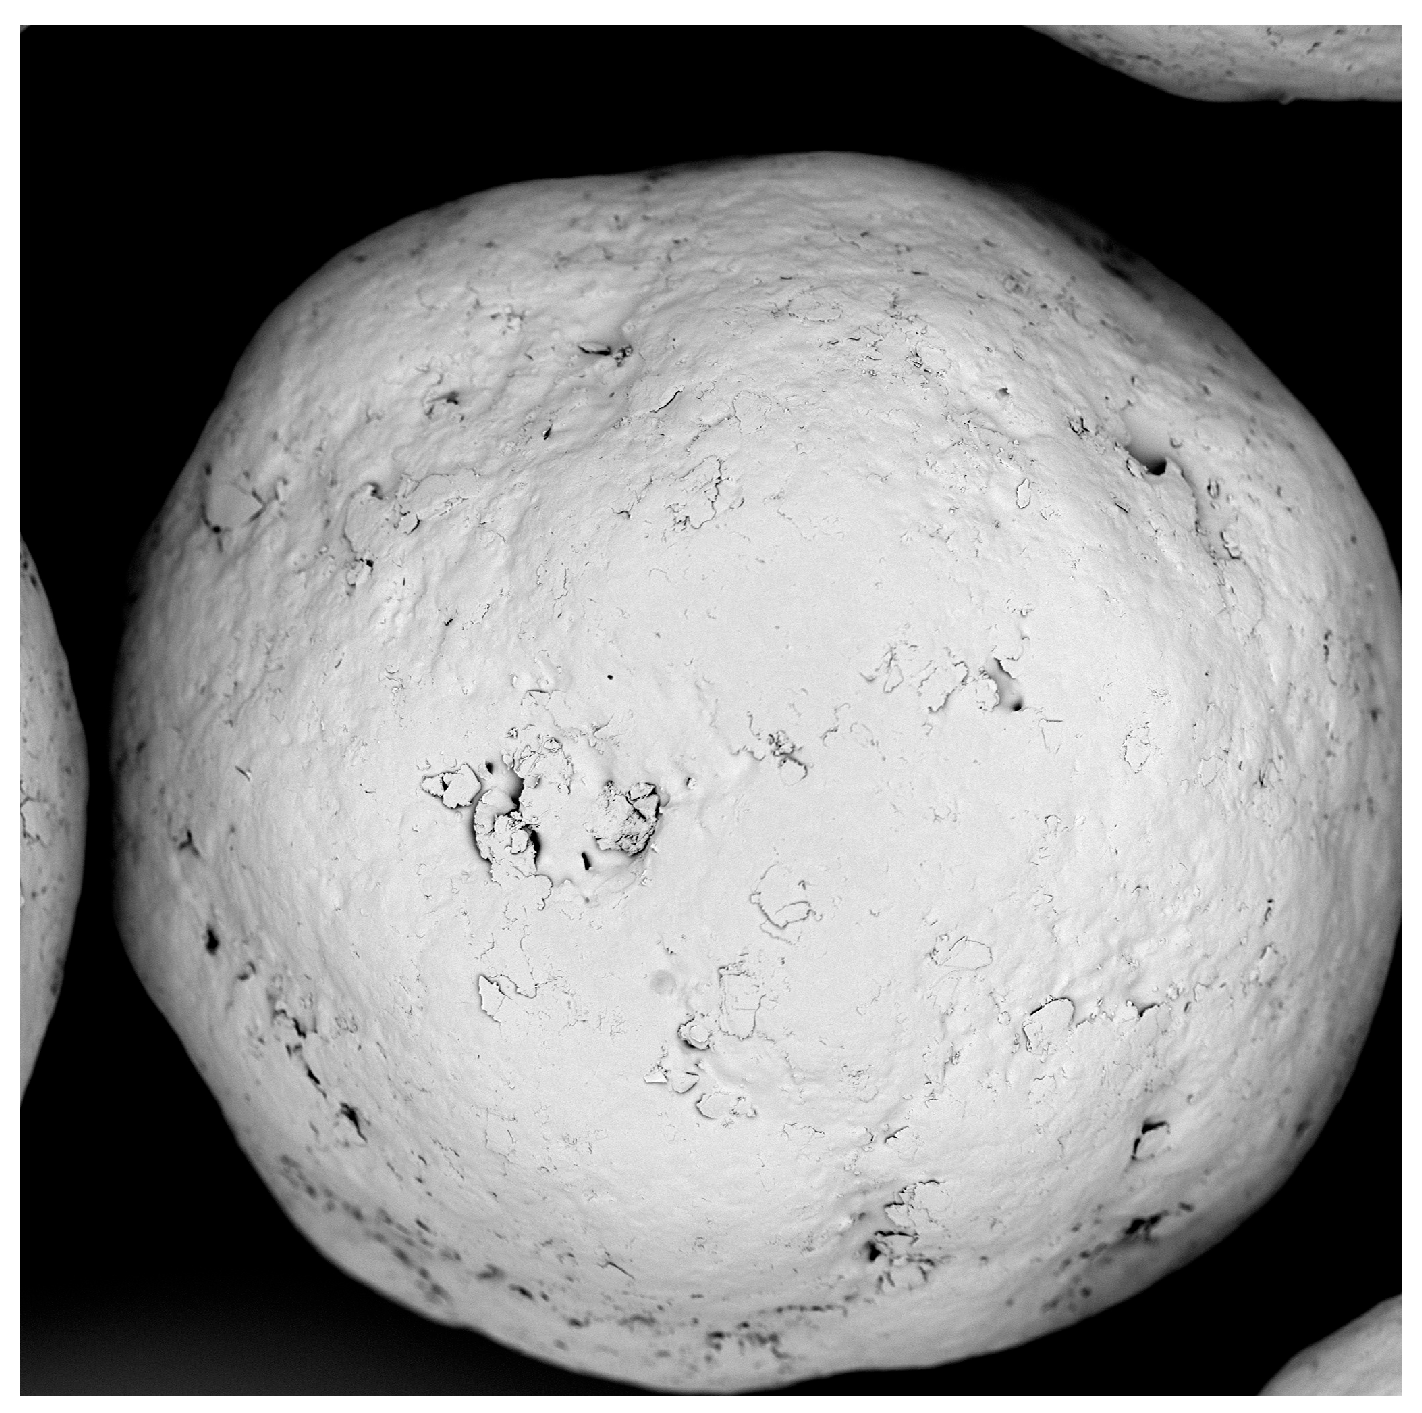
Therefore, the batch of dried non-plasticized (Figure 3) and three batches of glycerol-, water-, and DEC-loaded MCC spheres were used. Plasticizer-loaded MCC spheres contained 5.0 wt.% of water, 4.2 wt.% of glycerol, and 5.2 wt.% of DEC (Table 4, Figure 4).
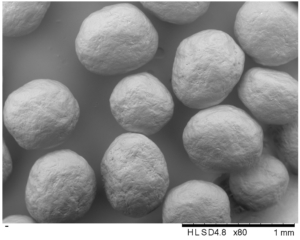
fig-3_Plasticity of Microcrystalline Cellulose Spheres

Figure 3. SEM of MCC spheres (D10% = 563 µm, D50% = 651 µm, and D90% = 696 µm).
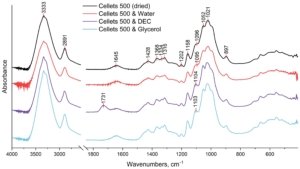
fig-4_Plasticity of Microcrystalline Cellulose Spheres

Figure 4. FTIR spectrum of dried and loaded MCC spheres in the range of 4000–500 cm−1.
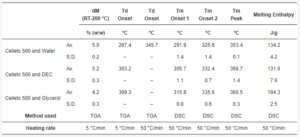
table-4

Table 4. The summary of thermal properties determined by TGA and DSC.

The dried and plasticizer-loaded MCC-spheres were investigated with FTIR spectroscopy (Figure 4). All obtained FTIR spectra showed the characteristic vibration peaks of cellulose [37,38,39,40,41,42]:
  • The broad peak at 3333 cm−1 which is assigned to O–H stretching vibrations of the intermolecularly bonded hydroxyl group;
  • The peak at 2891 cm−1 that corresponds to C–H stretching vibrations;
  • The peak at 1645 cm−1 which is indicative of the O–H bending of bound water;
  • The multiple absorbance bands (peaks at 1428, 1368, 1334, and 1316 cm−1) assigned to the bending and stretching vibrations of C–H and C–O bonds;
  • The peaks at 1202, 1052, and 1021 cm−1 are assigned to the elongation of C-O bonds;
  • The peaks at 1158 and 897 cm−1 are due to the C–O–C stretching vibrations at the β-glycosidic linkage.
No evident differences were observed in the spectrum of water-plasticized MCC spheres compared to the dried non-plasticized sample. This could be explained by the remaining bound water in all samples even after drying (as evidenced by the persistence of the peak at 1645 cm−1 in all obtained spectra [37,41,42]. Nonetheless, some changes were established for MCC spheres treated with DEC and glycerol. Both these plasticizers led to the manifestation of the peak at ~1104 cm−1, which could be related to the stretching vibrations of the C–O bond in the ester group of DEC and the secondary alcohol group of glycerol [43,44,45]. In addition, the spectrum of DEC-loaded MCC spheres demonstrated the most explicit deviation from that of the dried MCC spheres that manifested as a peak at 1731 cm−1 which was absent in the spectra of all other three samples. This peak could be assigned to the C=O stretching of the ester functional group [43]. Therefore, it can be suggested that treatment of MCC spheres with DEC and glycerol resulted in intermolecular hydrogen bonding between hydroxyl groups of cellulose (hydrogen donor) and mentioned functional groups of these plasticizers (hydrogen acceptors), and thus, at the molecular level, the plasticization could be caused by a weakening of intermolecular hydrogen bonds between adjacent cellulose chains [46]. It is interesting to note that it was the secondary alcohol hydroxy group of glycerol (at 1103 cm−1), and not the primary ones (at ~1030 cm−1) [45], that appeared in the spectrum of the glycerol-loaded MCC. As a rule, glycerol primary hydroxy groups are more reactive, and because of that, they are more likely to be involved in homo-intermolecular hydrogen bonding (i.e., glycerol–glycerol). With loading into MCC spheres, hetero-intermolecular hydrogen bonding occurred, i.e., cellulose–glycerol, which apparently was mostly contributed by the secondary alcohol hydroxy group of glycerol, while the homo-glycerol hydrogen bonding network could be preserved. Analogue findings were demonstrated in the study of the glycerol–choline eutectic mixture, which was found to have homo-molecular glycerol hydrogen bonding network similar to that in pure glycerol, whereas choline bonds were at the interstitial voids of the glycerol network [47].
pXRD is a complementary technique to DSC and was used in assessing the presence of crystalline content in formulations. Thus, the pXRD profiles of dried and plasticizer-loaded MCC spheres were investigated. The diffraction patterns of all samples confirmed the crystalline nature of each sample with the same characteristic peaks (Figure 5). The characteristic MCC peaks were also shown to be similar to that reported in the literature [48]. Unfortunately, the pXRD method was reported to have relatively low sensitivity and a limit of detectability (LoD) of 5% [49,50]. Thus, considering the plasticizer load (approx. 5%), the pXRD profiles obtained can be considered similar (with approximately the same level of crystallinity).
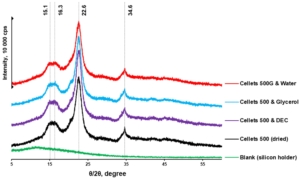
fig-5_Plasticity of Microcrystalline Cellulose Spheres

Figure 5. pXRD diffractograms of dried and loaded MCC spheres.

At a 5 °C/min heating rate, the onset of degradation temperature (Td onset) increased from water to DEC and glycerol (from 297.4 to 303.2 and 309.2 °C, respectively; Table 4, Figure 3). Melting of the MCC (DSC-curves) was observed upon its degradation (TGA-curve; Table 4, Figure 4). The increase in heating rate up to 50 °C/min made it possible to increase the Td onset for water-loaded MCC up to 345.7 °C and compare the melting onset temperatures (Tm onset) for MCC loaded with plasticizers. The part of the DSC curve that described melting demonstrated a two-step shape and was characterized by two Tm onsets. The increase in Tm onset 1 and Tm onset 2 was in the same sequence and increased from water to DEC and glycerol: 291.9, 305.7, 315.8 °C for Tm onset 1 and 325.6, 332.4, 335.6 °C for Tm onset 2, respectively (Table 4, Figure 6).
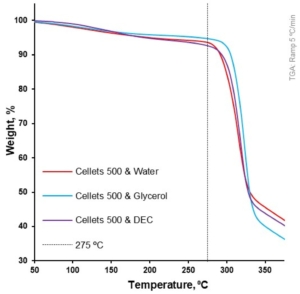
fig-6_Plasticity of Microcrystalline Cellulose Spheres

Figure 6. Weight loss as a function of temperature for loaded MCC spheres (TGA at 5 °C/min).

In this study, the Tm onset 1 and 2 (for water- and DEC-loaded samples) was associated with the thermal degradation of MCC [51]. That can be observed by comparing the first derivative of weight loss and respective Tm onset on the DSC profile of water-loaded MCC spheres (Figure 7). The increase in apparent melting peak temperature (Tm) and apparent melting enthalpy can be explained with the increase in Td from water to DEC and glycerol. Therefore, the thermal analysis did not provide us with insights regarding the plasticization of MCC with selected plasticizers.
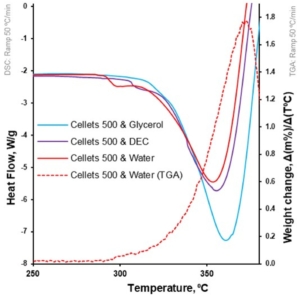
fig-7_Plasticity of Microcrystalline Cellulose Spheres

Figure 7. Heat flow as function of temperature for loaded MCC spheres (DSC at 50 °C/min; left Y-axis); the first derivative of weight loss as a function of temperature for water-loaded MCC spheres (TGA at 50 °C/min; right Y-axis).

Tableting of plasticizer-loaded MCC spheres with a compaction simulator was illustrated with pressure-displacement profiles (Figure 8a; exemplified with glycerol-loaded MCC spheres), which were converted to in-die Heckel plots (Figure 8b).
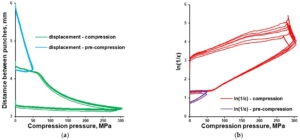
fig-8_Plasticity of Microcrystalline Cellulose Spheres

Figure 8. In-die Heckel plot (a) and pressure-displacement profile (b) for MCC spheres (CELLETS® 500) loaded with glycerol.

The mean yield pressure (Py) of non-plasticized MCC was found at the level of 136.5 ± 6.9 MPa (Av. ± S.D.). Despite the sequence of Tm onsets, the mean yield pressure of plasticizer-loaded MCC spheres decreased from DEC (124.7 ± 9.2 MPa) to water (106.6 ± 10.0 MPa) and glycerol (99.9 ± 1.9 MPa; Figure 9, Table 5). That coincided with the miscibility likelihood order based on the HSP calculations. Therefore DEC, water, and glycerol were able to decrease the Py of non-plasticized MCC spheres by 4.7, 16.3, and 38.9%, respectively.
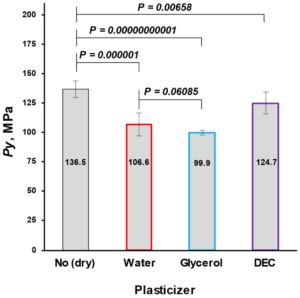
fig-9_Plasticity of Microcrystalline Cellulose Spheres

Figure 9. Comparison of non-plasticized (dried) with plasticized MCC spheres (Cellets® 500) in terms of Py (a plasticity parameter).
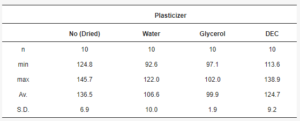
table-5

Table 5. Py data statistics.

Interestingly, despite FTIR revealing more hydrogen binding sites in the case of treatment with DEC (i.e., both C–O and C=O bonds of the ester functional group), glycerol with only one binding site (C–O bond of the alcohol group) was superior in its plasticizing ability, implying that MCC–glycerol hydrogen bonding was more efficient. This could be explained from the viewpoint of molecular weights of glycerol and DEC (92.09 and 248.23 g/mol, respectively). Considering an equal mass loading of both plasticizers (7.88 g), the loading of glycerol was 2.5 times higher in terms of molarity; therefore, more molecules of plasticizer were involved and, accordingly, more hydrogen bonds with cellulose could be formed in the case of glycerol. This follows the general logic that the smaller the molecule weight, the greater the plasticization effect of the plasticizer upon the polymer matrix [52]; however, the strength of intermolecular interactions should also be considered.
Water, as an MCC plasticizer, showed a relatively high ability to decrease Py (increase plasticity). The results obtained highlight the importance of water content in the raw MCC material. Changing the MCC plasticity by 16.3% (at 5 wt.%) significantly changed the mechanical properties. Thus, the fluctuation of moisture content in the MCC (even in the eligible pharmacopeial range) can be the reason for the variability of mechanical properties in complex tablet formulations [53]. Considering moisture as one of the most important factors in pharmaceutical tablets’ shelf-life, narrow specification of moisture content in MCC during the product development stage can be recommended.

4. Conclusions

This study showed the possibility of increasing the plasticity of MCC by loading it with a deliberately chosen plasticizer. The computational approaches based on solubility parameters were found to be useful in predicting the plasticizing efficacy. Based on FTIR findings, it is suggested that plasticization resulted from intermolecular hydrogen bonding between the plasticizers and cellulose molecules that caused the weakening of hydrogen bonds between adjacent cellulose chains. At the plasticizer load used (approx. 5 wt.%), neither pXRD nor DSC gave any insights on the plasticization of MCC with selected plasticizers. Because of the relatively high plasticization ability of water towards cellulose and thus potential changes in MCC mechanical properties, narrow specification of moisture content in MCC during the product development stage can be recommended.

Additonal information on: Plasticity of Microcrystalline Cellulose Spheres

Supplementary Materials

The following supporting information can be downloaded at: https://www.mdpi.com/article/10.3390/pharmaceutics16070945/s1, Table S1. Raw values of Py; Statistical analysis: One-Way ANOVA (α = 0.05).

Author Contributions

Methodology, formal analysis, investigation, data curation: V.M. and A.P.; visualization, writing—original draft preparation, writing—review and editing: A.P., T.K. and V.M.; conceptualization and supervision: V.M. All authors have read and agreed to the published version of the manuscript.

Funding

This research received no external funding.

Institutional Review Board Statement

Not applicable.

Informed Consent Statement

Not applicable.

Data Availability Statement

The data presented in this study are available on request from the corresponding author.

Acknowledgments

We would like to acknowledge the following people and their organisations for support of this project with pharmaceutical excipients. Business development manager Bastian Arlt (Glatt Pharmaceutical Services GmbH & Co. KG, Binzen, Germany) and head of business unit pharma Mandy Rehländer (HARKE Pharma GmbH, Mülheim an der Ruhr, Germany) for providing the CELLETS® 500-grade MCC spheres. We want to thank our colleagues Kirils Kukuls and Zoltán Márk Horváth for the data obtained with the compaction simulator and the improvement of the written English of this work, respectively. The author Tetiana Kolisnyk expresses a deep gratitude to the British Academy and Council for At-Risk Academics (UK) for the general and financial support in the frame of the Researchers-At-Risk program.

Conflicts of Interest

The authors declare that they have no conflicts of interest.

Lisence

The article “The Increase in the Plasticity of Microcrystalline Cellulose Spheres’ When Loaded with a Plasticizer” is published under Creative Common CC BY license. Any part of the article may be reused without permission provided that the original article is clearly cited. Reuse of an article does not imply endorsement by the authors or MDPI.

References

  1. Mohylyuk, V.; Bandere, D. High-speed tableting of high drug-loaded tablets prepared from fluid-bed granulated isoniazid. Pharmaceutics 2023, 15, 1236. [Google Scholar] [CrossRef] [PubMed]
  2. Romerova, S.; Dammer, O.; Zamostny, P. Development of an Image-based Method for Tablet Microstructure Description and Its Correlation with API Release Rate. AAPS PharmSciTech 2023, 24, 199. [Google Scholar] [CrossRef] [PubMed]
  3. Armstrong, N.A. Tablet Manufacture. In Encyclopedia of Pharmaceutical Technology; Swabrick, J., Ed.; Informa Healthcare USA, Inc.: New York, NY, USA, 2007; pp. 3653–3672. [Google Scholar]
  4. User Guide and Reference Manual of Software Alix (PR-W3-002); Korsch/MEDELPHARM: Berlin, Germany, 2020.
  5. Tay, J.Y.S.; Kok, B.W.T.; Liew, C.V.; Heng, P.W.S. Effects of Particle Surface Roughness on In-Die Flow and Tableting Behavior of Lactose. J. Pharm. Sci. 2019, 108, 3011–3019. [Google Scholar] [CrossRef] [PubMed]
  6. Heckel, R.W. Density-pressure relationships in powder compaction. Trans. Metal. Soc. AIME 1961, 221, 671–675. [Google Scholar]
  7. Hersey, J.A.; Rees, J.E. Deformation of Particles during Briquetting. Nat. Phys. Sci. 1971, 230, 96. [Google Scholar] [CrossRef]
  8. Vreeman, G.; Sun, C.C. Mean yield pressure from the in-die Heckel analysis is a reliable plasticity parameter. Int. J. Pharm. X 2021, 3, 100094. [Google Scholar] [CrossRef] [PubMed]
  9. Mohylyuk, V.; Paulausks, A.; Radzins, O.; Lauberte, L. The Effect of Microcrystalline Cellulose–CaHPO4 Mixtures in Different Volume Ratios on the Compaction and Structural–Mechanical Properties of Tablets. Pharmaceutics 2024, 16, 362. [Google Scholar] [CrossRef] [PubMed]
  10. Mohylyuk, V. Effect of roll compaction pressure on the properties of high drug-loaded piracetam granules and tablets. Drug Dev. Ind. Pharm. 2022, 48, 425–437. [Google Scholar] [CrossRef] [PubMed]
  11. Park, H.; Kim, J.S.; Hong, S.; Ha, E.S.; Nie, H.; Zhou, Q.T.; Kim, M.S. Tableting process-induced solid-state polymorphic transition. J. Pharm. Investig. 2022, 52, 175–194. [Google Scholar] [CrossRef]
  12. Thio, D.R.; Heng, P.W.S.; Chan, L.W. MUPS Tableting—Comparison between Crospovidone and Microcrystalline Cellulose Core Pellets. Pharmaceutics 2022, 14, 2812. [Google Scholar] [CrossRef] [PubMed]
  13. Dashevsky, A.; Kolter, K.; Bodmeier, R. Compression of pellets coated with various aqueous polymer dispersions. Int. J. Pharm. 2004, 279, 19–26. [Google Scholar] [CrossRef] [PubMed]
  14. Plumpton, E.J.; Gilbert, P.; Fell, J.T. The survival of microorganisms during tabletting. Int. J. Pharm. 1986, 30, 241–246. [Google Scholar] [CrossRef]
  15. Vorlander, K.; Bahlmann, L.; Kwade, A.; Finke, J.H.; Kampen, I. Effect of Process Parameters, Protectants and Carrier Materials on the Survival of Yeast Cells during Fluidized Bed Granulation for Tableting. Pharmaceutics 2023, 15, 884. [Google Scholar] [CrossRef] [PubMed]
  16. Galichet, L.Y. Cellulose Microcrystalline. In Handbook of Pharmaceutical Excipients; Rowe, R.C., Sheskey, P.J., Owen, S.C., Eds.; Pharmaceutical Press: London, UK; American Pharmacists Association: Grayslake, IL, USA, 2006. [Google Scholar]
  17. de la Luz Reus Medina, M.; Kumar, V. Comparative evaluation of powder and tableting properties of low and high degree of polymerization cellulose I and cellulose II excipients. Int. J. Pharm. 2007, 337, 202–209. [Google Scholar] [CrossRef] [PubMed]
  18. Sun, C.C. Mechanism of moisture induced variations in true density and compaction properties of microcrystalline cellulose. Int. J. Pharm. 2008, 346, 93–101. [Google Scholar] [CrossRef] [PubMed]
  19. Chamarthy, S.P.; Diringer, F.X.; Pinal, R. The Plasticization-Antiplasticization Threshold of Water in Microcrystalline Cellulose: A Perspective Based on Bulk Free Volume. In Water Properties in Food, Health, Pharmaceutical and Biological Systems; Reid, D.S., Sajjaanantakul, T., Eds.; Wiley-Blackwell: Hoboken, NJ, USA; Singapore, 2010; pp. 301–314. [Google Scholar]
  20. Osei-Yeboah, F. Improving Powder Tableting Performance through Materials Engineering. Ph.D. Thesis, University of Minnesota, Minneapolis, MN, USA, 2015. [Google Scholar]
  21. Siepmann, F.; Siepmann, J.; Walther, M.; MacRae, R.; Bodmeier, R. Aqueous HPMCAS coatings: Effects of formulation and processing parameters on drug release and mass transport mechanisms. Eur. J. Pharm. Biopharm. 2006, 63, 262–269. [Google Scholar] [CrossRef] [PubMed]
  22. Wesseling, M.; Bodmeier, R. Influence of plasticization time, curing conditions, storage time, and core properties on the drug release from Aquacoat-coated pellets. Pharm. Dev. Technol. 2001, 6, 325–331. [Google Scholar] [CrossRef] [PubMed]
  23. Matic, J.; Paudel, A.; Bauer, H.; Garcia, R.A.L.; Biedrzycka, K.; Khinast, J.G. Developing HME-Based Drug Products Using Emerging Science: A Fast-Track Roadmap from Concept to Clinical Batch. AAPS PharmSciTech 2020, 21, 176. [Google Scholar] [CrossRef] [PubMed]
  24. Oladeji, S.; Mohylyuk, V.; Jones, D.S.; Andrews, G.P. 3D printing of pharmaceutical oral solid dosage forms by fused deposition: The enhancement of printability using plasticised HPMCAS. Int. J. Pharm. 2022, 616, 121553. [Google Scholar] [CrossRef]
  25. Klar, F.; Urbanetz, N.A. Solubility parameters of hypromellose acetate succinate and plasticization in dry coating procedures. Drug Dev. Ind. Pharm. 2016, 42, 1621–1635. [Google Scholar] [CrossRef] [PubMed]
  26. Medarevic, D.; Djuriš, J.; Barmpalexis, P.; Kachrimanis, K.; Ibrić, S. Analytical and Computational Methods for the Estimation of Drug-Polymer Solubility and Miscibility in Solid Dispersions Development. Pharmaceutics 2019, 11, 372. [Google Scholar] [CrossRef] [PubMed]
  27. Kitak, T.; Dumičić, A.; Planinšek, O.; Šibanc, R.; Srčič, S. Determination of Solubility Parameters of Ibuprofen and Ibuprofen Lysinate. Molecules 2015, 20, 21549–21568. [Google Scholar] [CrossRef] [PubMed]
  28. Hansen, C.M. Hansen. Solubility Parameters: A User’s Handbook; CRC Press LLC: Boca Raton, FL, USA, 2000. [Google Scholar]
  29. Kolisnyk, T.; Mohylyuk, V.; Andrews, G.P. Drug-Polymer Miscibility and Interaction Study as a Preliminary Step in Amorphous Solid Dispersion Development: Comparison of Theoretical and Experimental Data. Maced. Pharm. Bull. 2023, 69, 59–60. [Google Scholar] [CrossRef]
  30. Van Krevelen, D.W.; Nijenhuis, K.T. Cohesive Properties and Solubility. In Properties of Polymers; Elsevier: Amsterdam, The Netherlands, 2009. [Google Scholar]
  31. Jankovic, S.; Tsakiridou, G.; Ditzinger, F.; Koehl, N.J.; Price, D.J.; Ilie, A.R.; Kalantzi, L.; Kimpe, K.; Holm, R.; Nair, A.; et al. Application of the solubility parameter concept to assist with oral delivery of poorly water-soluble drugs—A PEARRL review. J. Pharm. Pharmacol. 2019, 71, 441–463. [Google Scholar] [CrossRef] [PubMed]
  32. Pitzanti, G.; Mohylyuk, V.; Corduas, F.; Byrne, N.M.; Coulter, J.A.; Lamprou, D.A. Urethane dimethacrylate-based photopolymerizable resins for stereolithography 3D printing: A physicochemical characterisation and biocompatibility evaluation. Drug Deliv. Transl. Res. 2023, 14, 177–190. [Google Scholar] [CrossRef] [PubMed]
  33. Elsergany, R.N.; Vreeman, G.; Sun, C.C. An approach for predicting the true density of powders based on in-die compression data. Int. J. Pharm. 2023, 637, 122875. [Google Scholar] [CrossRef] [PubMed]
  34. Price, J.C. Glycerin. In Handbook of Pharmaceutical Excipients; Rowe, R.C., Sheskey, P.J., Owen, S.C., Eds.; Pharmaceutical Press: London, UK; American Pharmacists Association: Grayslake, IL, USA, 2006. [Google Scholar]
  35. CAS Data Base: DIETHYL CITRATE; ChemicalBook: San Jose, CA, USA, 2023.
  36. Fell, J.T.; Newton, J.M. Effect of particle size and speed of compaction on density changes in tablets of crystalline and spray-dried lactose. J. Pharm. Sci. 1971, 60, 1866–1869. [Google Scholar] [CrossRef] [PubMed]
  37. Panaitescu, D.M.; Vizireanu, S.; Stoian, S.A.; Nicolae, C.A.; Gabor, A.R.; Damian, C.M.; Trusca, R.; Carpen, L.G.; Dinescu, G. Poly(3-hydroxybutyrate) Modified by Plasma and TEMPO-Oxidized Celluloses. Polymers 2020, 12, 1510. [Google Scholar] [CrossRef] [PubMed]
  38. Yu, H.; Qin, Z.; Liang, B.; Liu, N.; Zhou, Z.; Chen, L. Facile extraction of thermally stable cellulose nanocrystals with a high yield of 93% through hydrochloric acid hydrolysis under hydrothermal conditions. J. Mater. Chem. A 2013, 1, 3938–3944. [Google Scholar] [CrossRef]
  39. Lu, P.; Hsieh, Y.L. Preparation and properties of cellulose nanocrystals: Rods, spheres, and network. Carbohydr. Polym. 2010, 82, 329–336. [Google Scholar] [CrossRef]
  40. Agrebi, F.; Ghorbel, N.; Bresson, S.; Abbas, O.; Kallel, A. Study of nanocomposites based on cellulose nanoparticles and natural rubber latex by ATR/FTIR spectroscopy: The impact of reinforcement. Polym. Compos. 2018, 40, 2076–2087. [Google Scholar] [CrossRef]
  41. Li, M.; He, B.; Chen, Y.; Zhao, L. Physicochemical Properties of Nanocellulose Isolated from Cotton Stalk Waste. ACS Omega 2021, 6, 25162–25169. [Google Scholar] [CrossRef] [PubMed]
  42. Haafiz, M.K.; Xue, J.F.; Xu, M.; Gui, B.S.; Kuang, L.; Ouyang, J.M. Isolation and characterization of cellulose nanowhiskers from oil palm biomass microcrystalline cellulose. Carbohydr. Polym. 2014, 103, 119–125. [Google Scholar] [CrossRef] [PubMed]
  43. Han, J.; Xue, J.F.; Xu, M.; Gui, B.S.; Kuang, L.; Ouyang, J.M. Coordination dynamics and coordination mechanism of a new type of anticoagulant diethyl citrate with Ca2+ ions. Bioinorg. Chem. Appl. 2013, 2013, 354736. [Google Scholar] [CrossRef] [PubMed]
  44. Perez, C.D.; Flores, S.K.; Marangoni, A.G.; Gerschenson, L.N.; Rojas, A.M. Development of a high methoxyl pectin edible film for retention of l-(+)-ascorbic acid. J. Agric. Food Chem. 2009, 57, 6844–6855. [Google Scholar] [CrossRef] [PubMed]
  45. Armylisas, A.H.N.; Hoong, S.S.; Ismail, T.N.M.T. Characterization of crude glycerol and glycerol pitch from palm-based residual biomass. Biomass Conv. Bioref. 2023, 1–13. [Google Scholar] [CrossRef] [PubMed]
  46. Cielecka, I.; Szustak, M.; Kalinowska, H.; Gendaszewska-Darmach, E.; Ryngajłło, M.; Maniukiewicz, W.; Bielecki, S. Glycerol-plasticized bacterial nanocellulose-based composites with enhanced flexibility and liquid sorption capacity. Cellulose 2019, 26, 5409–5426. [Google Scholar] [CrossRef]
  47. Turner, A.H.; Holbrey, J.D. Investigation of glycerol hydrogen-bonding networks in choline chloride/glycerol eutectic-forming liquids using neutron diffraction. Phys. Chem. Chem. Phys. 2019, 21, 21782–21789. [Google Scholar] [CrossRef] [PubMed]
  48. Mohylyuk, V.; Pauly, T.; Dobrovolnyi, O.; Scott, N.; Jones, D.S.; Andrews, G.P. Effect of carrier type and Tween® 80 concentration on the release of silymarin from amorphous solid dispersions. J. Drug Deliv. Sci. Technol. 2021, 63, 102416. [Google Scholar] [CrossRef]
  49. Song, M.; Liebenberg, W.; De Villiers, M.M. Comparison of high sensitivity micro differential scanning calorimetry with X-ray powder diffractometry and FTIR spectroscopy for the characterization of pharmaceutically relevant non-crystalline materials. Die Pharm.-Int. J. Pharm. Sci. 2006, 61, 336–340. [Google Scholar]
  50. Dedroog, S.; Pas, T.; Vergauwen, B.; Huygens, C.; Van den Mooter, G. Solid-state analysis of amorphous solid dispersions: Why DSC and XRPD may not be regarded as stand-alone techniques. J. Pharm. Biomed. Anal. 2020, 178, 112937. [Google Scholar] [CrossRef] [PubMed]
  51. Lu, Y.; Yin, L.; Gray, D.L.; Thomas, L.C.; Schmidt, S.J. Impact of sucrose crystal composition and chemistry on its thermal behavior. J. Food Eng. 2017, 214, 193–208. [Google Scholar] [CrossRef]
  52. Tong, Q.; Xiao, Q.; Lim, L.T. Effects of glycerol, sorbitol, xylitol and fructose plasticisers on mechanical and moisture barrier properties of pullulan–alginate–carboxymethylcellulose blend films. Int. J. Food Sci. Technol. 2012, 48, 870–878. [Google Scholar] [CrossRef]
  53. Amidon, G.E.; Houghton, M.E. The effect of moisture on the mechanical and powder flow properties of microcrystalline cellulose. Pharm. Res. 1995, 12, 923–929. [Google Scholar] [CrossRef] [PubMed]

Titelbild Brezovar-2023

Abstract

The focus of the current work is to study and demonstrate the impact of the design, the scale, and settings of fluid-bed coating equipment on the differences in pellet coating thickness, which in case of prolonged-release pellets dictates the drug release. In the first set of coating experiments, the pellet cores were coated with the Tartrazine dye with the aim of estimating the coating equipment performance in terms of coating thickness distribution, assessed through color hue. In the second set, drug-layered pellets were film-coated with prolonged-release coating and dissolution profile tests were performed to estimate the thickness and uniformity of the coating thickness among differently sized pellets. In both study parts, film coating was performed at the laboratory and the pilot scale and essentially two types of distribution plate and different height adjustments of the draft tube were compared. The dye coating study proved to be extremely useful, as the results enable process correction and the optimal use of the process equipment in combination with the appropriate process parameters. Preferential film coating of larger drug-containing pellets was confirmed on the laboratory scale, while on the pilot scale, it was possible to achieve preferential coating of smaller pellets using rational alternatives of settings, which is desirable in terms of particle size-independent drug release profile of such prolonged-release dosage forms. […]

Materials

In the first part of the study, neutral MCC pellets (CELLETS 700, IPC Process Center GmbH, Germany) were coated with water solution composed of 8% w/w HPMC 6 mPas (Shin-Etsu Chemical, Japan), 1% w/w Macrogol 6000 (Clariant Produkte GmbH, Glendorf site, Germany), 1% w/w coloring agent Tartrazine (Sigma-Aldrich, USA), and purified water (90%, w/w).

In the second part of coating experiments, API-coated pellets containing Diclofenac sodium were coated with water-based sustained release coating dispersion containing Eudragit RS 30D (9.6% w/w), Eudragit RL 30 D (19.2% w/w) (Evonic Nutrition Care GmbH, Germany), 1.7% w/w triethyl citrate (Vertellus LLC, USA), and 10.4% w/w talc.

Methods

Pellet Film-Coating Experiments with Tartrazin

Coating experiments using Tartrazine dye were performed on two laboratory-sized fluid-bed coaters (GPCG1, Glatt GmbH, Germany and BX FBD10, Brinox d.o.o., Slovenia) and on one pilot-sized (BX FBD30, Brinox d.o.o., Slovenia) fluid-bed coater. In case of both laboratory coaters, the type of distribution plate and the gap between the plate and the draft tube were varied. The pilot-scale setup with three swirl generators and draft tubes was used, while only the size of the gap was varied during coating experiments (Table I). All other process parameters were comparable within each coating process scale. […]

Size distributions of uncoated CELLETS® 700 used in Tartrazine coating experiments and of drug-layered pellets used in PR coating experiments

Size distributions of uncoated CELLETS® 700 used in Tartrazine coating experiments and of drug-layered pellets used in PR coating experiments

Conclusion

Considering the results of the coating process evaluation with the dye-coated pellet approach, based on previous research, it can be said that the obtained positive slopes of size preferential coating in the laboratory-scale CW process chamber are within the expected performance of this type of coater design. The values of the slope of the size preferential coating were always lower in the case of the SW distribution plate in comparison with the CW design of the distribution plate. However, within the laboratory-scale coater designs, different performances of swirl generator equipped flat and funnel-shaped distribution plates were identified, the latter exhibiting the least size dependent preferential coating performance. This was attributed to a less expressed dead zone effect enabling mixing and elimination of any segregation in the pellet bed region of the coater. On the pilot film-coating scale, coater equipped with flat SW distribution plates exhibited negative size preferential coating slope, meaning that smaller pellets obtained more coating than larger ones, which is unprecedented result. Moreover, the extent of the negative size preferential coating slope depended on the dynamics of the pressure drop fluctuations. This finding was effectively translated to the prolonged-release coating application, where the right extent of the negative size preferential coating ensures pellet size-independent drug release profiles, thus improving robustness of such multiple unit prolonged-release formulation. By lowering the air flow rate and using bimodal size distribution, rich in smaller drug-layered pellets, led to rather surprising results, where performance of prolonged drug release-coated pellets did not resemble size preferential coating results from the dye coating study part.

These results confirm the fact that we must have a good knowledge of the coater performance characteristics in combination with the process variables and even formulation properties, if we want to produce coated multiple-unit solid pharmaceutical products of the highest quality.

Disclaimer

Excerpt from: AAPS PharmSciTech, 24, 93 (2023), https://doi.org/10.1208/s12249-023-02540-9. by T. Brezovar, G. Hudovornik, M. Perpar, M. Luštrik, and R. Dreu.