Abstract
Microcrystalline Cellulose (MCC) pellets represent a chemically inert class of active pharmaceutical ingredients (API) carriers. A narrow particle size distribution (PSD) maximizes control over content uniformity. In this case study, we will focus on measuring the particle size distribution and on sphericity.
Pellets for oral drug forms
MCC pellets are used as starter beads for API loading. Low or high drug dose loading is technically feasible. These pellets are made of pure MCC and provide a robust platform for delivery of one or multiple APIs. Certain processing technologies for pellet coating allow these starter beads to be compatible with soluble or insoluble APIs, e.g. by Wurster bottom spray [1,2] or Rotor dry powder layering technology [3]. Coated pellets can be filled into capsules, or compacted into multiple-unit pellet system (MUPS) tablets [4], where a tight PSD maximizes control over content uniformity.
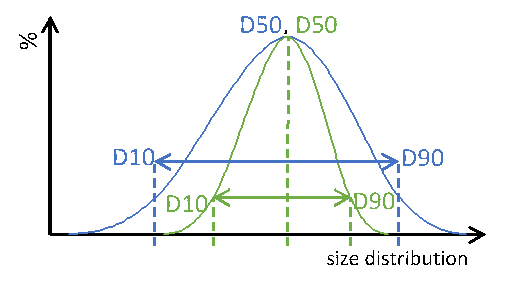
Particle size distribution maximizes the control over content uniformity in applications of complex oral dosing forms. Speaking about uniform or monodisperse particles, these information always point to general information of the particular system, not of the individual particle itself. Therefore, PSD is a globular measure allowing simple, easy and fast analysis of the particulate matter. Major key information from a PSD measure are the so called D-values. A Dx value represents a dimension, where a ratio of X particles is smaller. For reasons of simplicity weighted functions, such as number, radius or volume, are not. Extending these metrics to D10 and D90 additionally informs about the width of the entire size distribution (Figure 1).
Particle size distribution of two different particle systems with identical median dimension D50. Blue: wide PSD, green: narrow PSD. Dotted lines are guides to the eyes.
Figure 1: Particle size distribution of two different particle systems with identical median dimension D50. Blue: wide PSD, green: narrow PSD. Dotted lines are guides to the eyes.
Dimensions of pellets
In this study, imaging technology (Horiba, Camsizer) was employed for the size analysis. Representatively, more than 50 charges of Cellets® 100 and Cellets® 500 (Figures 2-3) have been analyzed for the D10, D50 and D90 values.
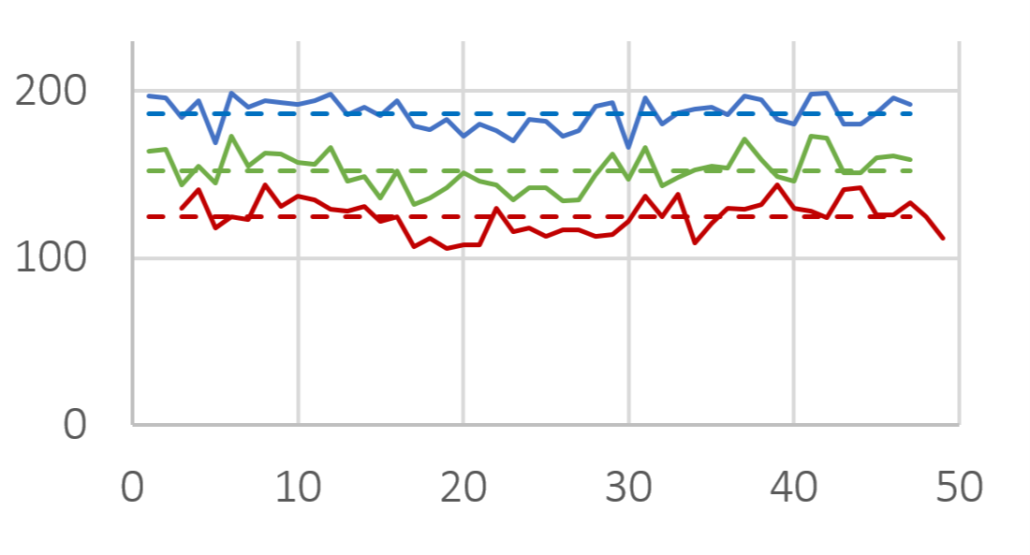
D10 (red), D50 (green) and D90 (blue) value for several Cellets® 100 charges. Solid lines are measures, dashed lines represent the averaged value of all charges. The standard deviation is below 10 %.
Figure 2: D10 (red), D50 (green) and D90 (blue) value for several Cellets® 100 charges. Solid lines are measures, dashed lines represent the averaged value of all charges. The standard deviation is below 10 %.
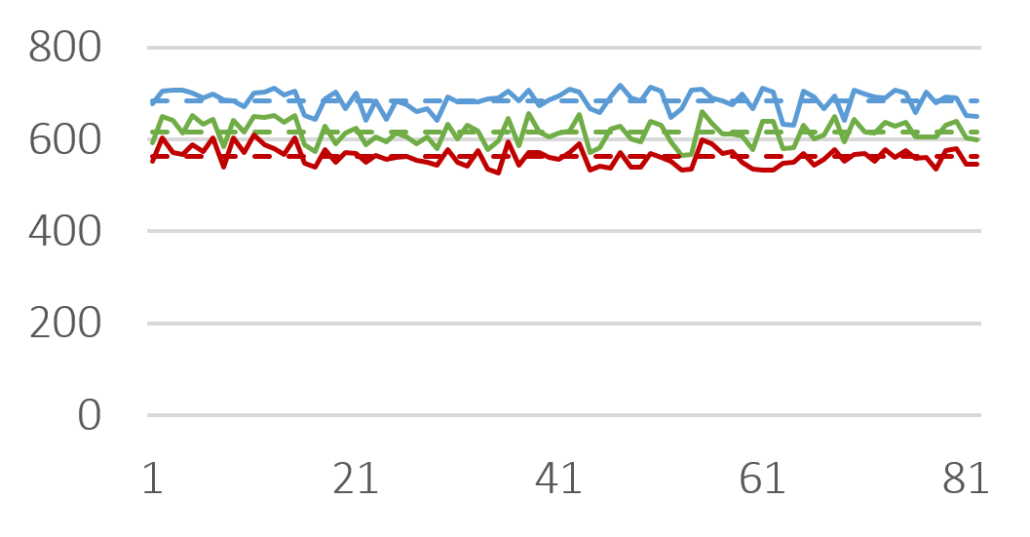
D10 (red), D50 (green) and D90 (blue) value for several Cellets® 500 charges. Solid lines are measures, dashed lines represent the averaged value of all charges. The standard deviation is below 4 %.
Figure 3: D10 (red), D50 (green) and D90 (blue) value for several Cellets® 500 charges. Solid lines are measures, dashed lines represent the averaged value of all charges. The standard deviation is below 4 %.
The results show only slight variations in the PSD between the charges. The standard deviation is smaller than 4 % (Cellets® 500) and smaller than 10 % (Cellets® 100) which confirms a high reproducibility in production (Table 1). Both values are remarkably good for technical spheres. Furthermore, none of the charges was out of specifications and fit into the desired size distribution between 500 µm and 710 µm easily. The close gap between D10 and D90 clearly identify an excellent monodispersity.
| Standard deviation | Cellets 100 | Cellets 500 |
| of D10 | 8.28 % | 3.97 % |
| of D50 | 7.12 % | 3.52 % |
| of D90 | 4.68 % | 3.11 % |
Table 1: Standard deviation for D10, D50 and D90 values Cellets® 100 and Cellets® 500 charges.
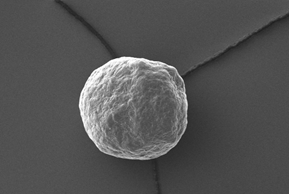
Electron microscopy yield perfect imaging data of the MCC pellets’ surfaces. Magnification: 250x, working distance 8.0 mm, voltage: 10 keV.
Figure 4: Electron microscopy yield perfect imaging data of the MCC pellets’ surfaces. Magnification: 250x, working distance 8.0 mm, voltage: 10 keV.
Perfect sphericity? – Yes!
For a more detailed shape analysis, electron microscopy yield perfect imaging data of the MCC pellets’ surfaces (Figure 4). Additionally, MCC pellets have a distinguishing friability.
Summary
Microcrystalline Cellulose (MCC) pellets show excellent chemically inertness, high degree of sphericity, narrow size distribution and high reproducibility in production. These properties make Cellets® becoming one of the first choice for inert API carriers. We have proven these excellent properties for Cellets® 100 and Cellets® 500. The obtained results are representative for other size classes ranging from 100 µm to 1400 µm.
Acknowledgement
We acknowledge IPC Process-Center (Dresden, Germany) for the analytics, and Fraunhofer IFAM (Dresden, Germany) for recording the electron microscopic pictures.
References
[1] H. R. Norouzi, International Journal of Pharmaceutics, Volume 590 (2020) 119931
[2] D. Jones, Developing Solid Oral Dosage Forms, Pharmaceutical Theory And Practice (2009) 807-825
[4] S. Abdul, A. Chandewar, S. Jaiswal, Journal of Controlled Release, Volume 147(1) (2010) 2-16

")
. Red: ASD pellets from direct pelletization (SB). Blue: physical mixture.")


 ingredientpharm
